
Download Lectures on Biostatistics (1971). Corrected and searchable version of Google books edition
Download review of Lectures on Biostatistics (THES, 1973).
reproducibility
|
“Statistical regression to the mean predicts that patients selected for abnormalcy will, on the average, tend to improve. We argue that most improvements attributed to the placebo effect are actually instances of statistical regression.”
“Thus, we urge caution in interpreting patient improvements as causal effects of our actions and should avoid the conceit of assuming that our personal presence has strong healing powers.” |
In 1955, Henry Beecher published "The Powerful Placebo". I was in my second undergraduate year when it appeared. And for many decades after that I took it literally, They looked at 15 studies and found that an average 35% of them got "satisfactory relief" when given a placebo. This number got embedded in pharmacological folk-lore. He also mentioned that the relief provided by placebo was greatest in patients who were most ill.
Consider the common experiment in which a new treatment is compared with a placebo, in a double-blind randomised controlled trial (RCT). It’s common to call the responses measured in the placebo group the placebo response. But that is very misleading, and here’s why.
The responses seen in the group of patients that are treated with placebo arise from two quite different processes. One is the genuine psychosomatic placebo effect. This effect gives genuine (though small) benefit to the patient. The other contribution comes from the get-better-anyway effect. This is a statistical artefact and it provides no benefit whatsoever to patients. There is now increasing evidence that the latter effect is much bigger than the former.
How can you distinguish between real placebo effects and get-better-anyway effect?
The only way to measure the size of genuine placebo effects is to compare in an RCT the effect of a dummy treatment with the effect of no treatment at all. Most trials don’t have a no-treatment arm, but enough do that estimates can be made. For example, a Cochrane review by Hróbjartsson & Gøtzsche (2010) looked at a wide variety of clinical conditions. Their conclusion was:
“We did not find that placebo interventions have important clinical effects in general. However, in certain settings placebo interventions can influence patient-reported outcomes, especially pain and nausea, though it is difficult to distinguish patient-reported effects of placebo from biased reporting.”
In some cases, the placebo effect is barely there at all. In a non-blind comparison of acupuncture and no acupuncture, the responses were essentially indistinguishable (despite what the authors and the journal said). See "Acupuncturists show that acupuncture doesn’t work, but conclude the opposite"
So the placebo effect, though a real phenomenon, seems to be quite small. In most cases it is so small that it would be barely perceptible to most patients. Most of the reason why so many people think that medicines work when they don’t isn’t a result of the placebo response, but it’s the result of a statistical artefact.
Regression to the mean is a potent source of deception
The get-better-anyway effect has a technical name, regression to the mean. It has been understood since Francis Galton described it in 1886 (see Senn, 2011 for the history). It is a statistical phenomenon, and it can be treated mathematically (see references, below). But when you think about it, it’s simply common sense.
You tend to go for treatment when your condition is bad, and when you are at your worst, then a bit later you’re likely to be better, The great biologist, Peter Medawar comments thus.
|
"If a person is (a) poorly, (b) receives treatment intended to make him better, and (c) gets better, then no power of reasoning known to medical science can convince him that it may not have been the treatment that restored his health"
(Medawar, P.B. (1969:19). The Art of the Soluble: Creativity and originality in science. Penguin Books: Harmondsworth). |
This is illustrated beautifully by measurements made by McGorry et al., (2001). Patients with low back pain recorded their pain (on a 10 point scale) every day for 5 months (they were allowed to take analgesics ad lib).
The results for four patients are shown in their Figure 2. On average they stay fairly constant over five months, but they fluctuate enormously, with different patterns for each patient. Painful episodes that last for 2 to 9 days are interspersed with periods of lower pain or none at all. It is very obvious that if these patients had gone for treatment at the peak of their pain, then a while later they would feel better, even if they were not actually treated. And if they had been treated, the treatment would have been declared a success, despite the fact that the patient derived no benefit whatsoever from it. This entirely artefactual benefit would be the biggest for the patients that fluctuate the most (e.g this in panels a and d of the Figure).
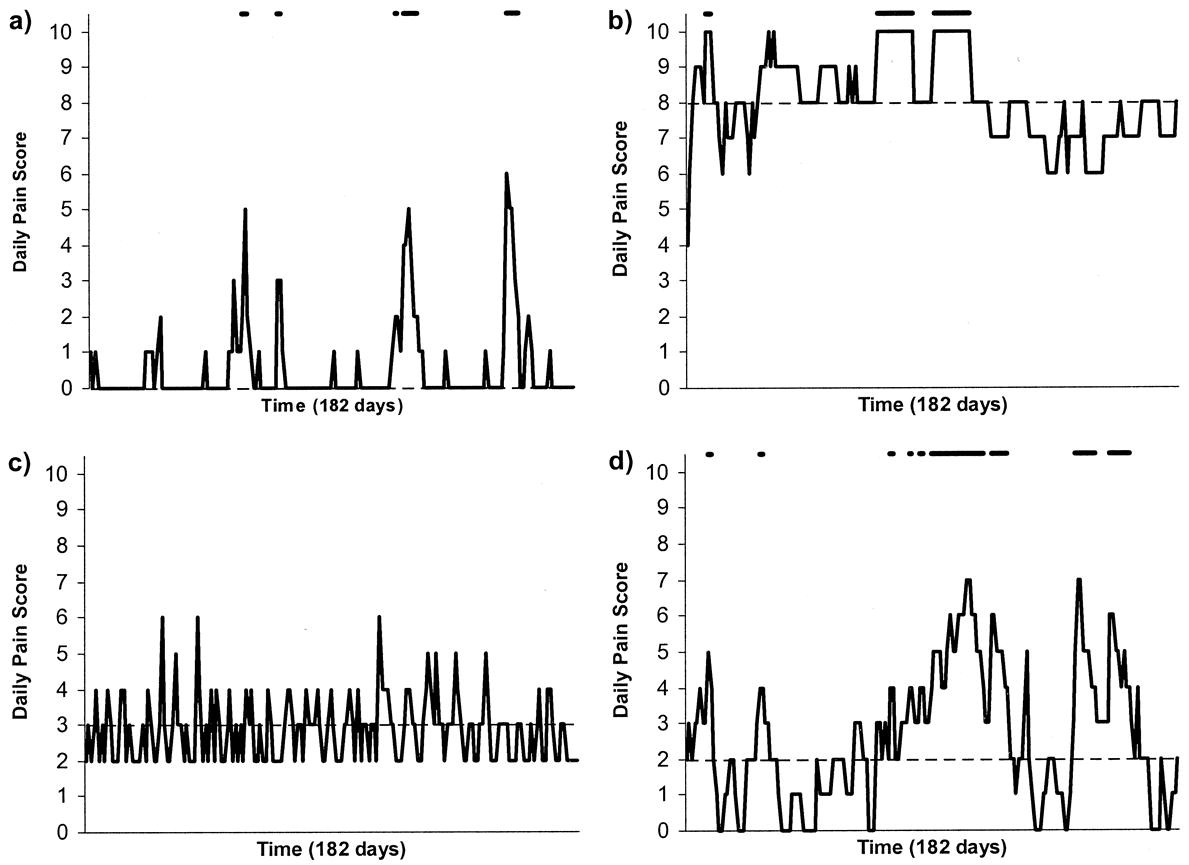
Figure 2 from McGorry et al, 2000. Examples of daily pain scores over a 6-month period for four participants. Note: Dashes of different lengths at the top of a figure designate an episode and its duration.
The effect is illustrated well by an analysis of 118 trials of treatments for non-specific low back pain (NSLBP), by Artus et al., (2010). The time course of pain (rated on a 100 point visual analogue pain scale) is shown in their Figure 2. There is a modest improvement in pain over a few weeks, but this happens regardless of what treatment is given, including no treatment whatsoever.
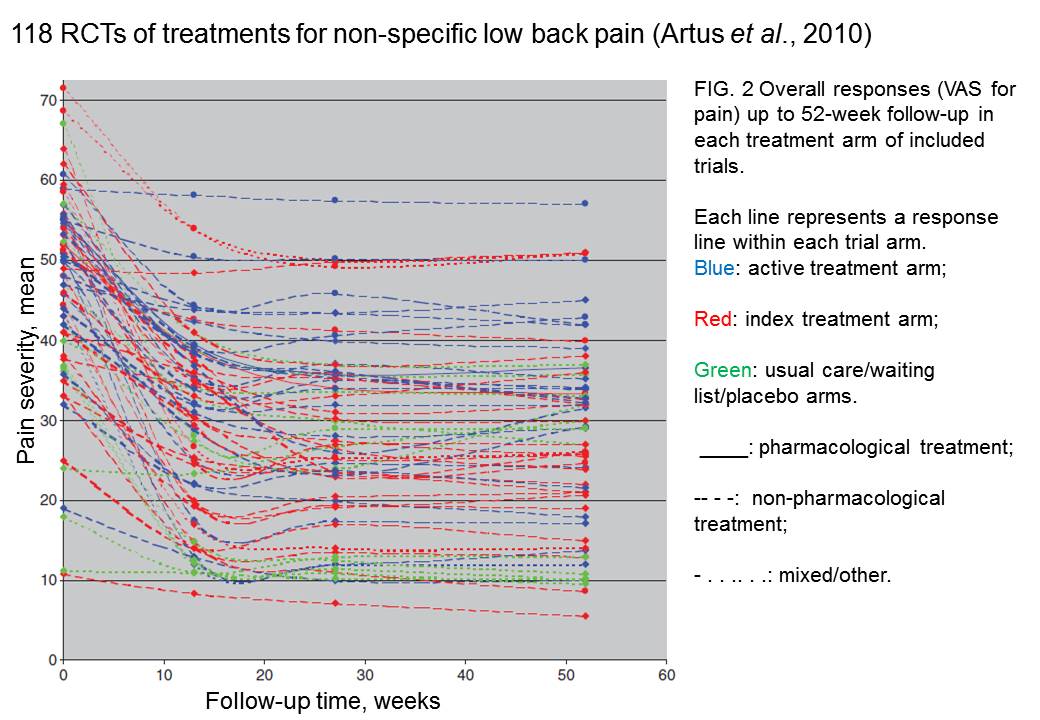
FIG. 2 Overall responses (VAS for pain) up to 52-week follow-up in each treatment arm of included trials. Each line represents a response line within each trial arm. Red: index treatment arm; Blue: active treatment arm; Green: usual care/waiting list/placebo arms. ____: pharmacological treatment; – – – -: non-pharmacological treatment; . . .. . .: mixed/other.
The authors comment
"symptoms seem to improve in a similar pattern in clinical trials following a wide variety of active as well as inactive treatments.", and "The common pattern of responses could, for a large part, be explained by the natural history of NSLBP".
In other words, none of the treatments work.
This paper was brought to my attention through the blog run by the excellent physiotherapist, Neil O’Connell. He comments
"If this finding is supported by future studies it might suggest that we can’t even claim victory through the non-specific effects of our interventions such as care, attention and placebo. People enrolled in trials for back pain may improve whatever you do. This is probably explained by the fact that patients enrol in a trial when their pain is at its worst which raises the murky spectre of regression to the mean and the beautiful phenomenon of natural recovery."
O’Connell has discussed the matter in recent paper, O’Connell (2015), from the point of view of manipulative therapies. That’s an area where there has been resistance to doing proper RCTs, with many people saying that it’s better to look at “real world” outcomes. This usually means that you look at how a patient changes after treatment. The hazards of this procedure are obvious from Artus et al.,Fig 2, above. It maximises the risk of being deceived by regression to the mean. As O’Connell commented
"Within-patient change in outcome might tell us how much an individual’s condition improved, but it does not tell us how much of this improvement was due to treatment."
In order to eliminate this effect it’s essential to do a proper RCT with control and treatment groups tested in parallel. When that’s done the control group shows the same regression to the mean as the treatment group. and any additional response in the latter can confidently attributed to the treatment. Anything short of that is whistling in the wind.
Needless to say, the suboptimal methods are most popular in areas where real effectiveness is small or non-existent. This, sad to say, includes low back pain. It also includes just about every treatment that comes under the heading of alternative medicine. Although these problems have been understood for over a century, it remains true that
|
"It is difficult to get a man to understand something, when his salary depends upon his not understanding it."
Upton Sinclair (1935) |
Responders and non-responders?
One excuse that’s commonly used when a treatment shows only a small effect in proper RCTs is to assert that the treatment actually has a good effect, but only in a subgroup of patients ("responders") while others don’t respond at all ("non-responders"). For example, this argument is often used in studies of anti-depressants and of manipulative therapies. And it’s universal in alternative medicine.
There’s a striking similarity between the narrative used by homeopaths and those who are struggling to treat depression. The pill may not work for many weeks. If the first sort of pill doesn’t work try another sort. You may get worse before you get better. One is reminded, inexorably, of Voltaire’s aphorism "The art of medicine consists in amusing the patient while nature cures the disease".
There is only a handful of cases in which a clear distinction can be made between responders and non-responders. Most often what’s observed is a smear of different responses to the same treatment -and the greater the variability, the greater is the chance of being deceived by regression to the mean.
For example, Thase et al., (2011) looked at responses to escitalopram, an SSRI antidepressant. They attempted to divide patients into responders and non-responders. An example (Fig 1a in their paper) is shown.
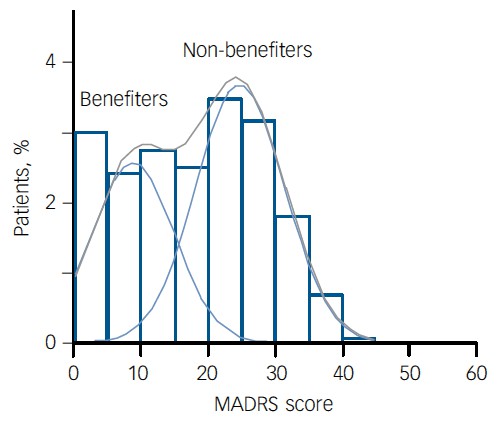
The evidence for such a bimodal distribution is certainly very far from obvious. The observations are just smeared out. Nonetheless, the authors conclude
"Our findings indicate that what appears to be a modest effect in the grouped data – on the boundary of clinical significance, as suggested above – is actually a very large effect for a subset of patients who benefited more from escitalopram than from placebo treatment. "
I guess that interpretation could be right, but it seems more likely to be a marketing tool. Before you read the paper, check the authors’ conflicts of interest.
The bottom line is that analyses that divide patients into responders and non-responders are reliable only if that can be done before the trial starts. Retrospective analyses are unreliable and unconvincing.
Some more reading
Senn, 2011 provides an excellent introduction (and some interesting history). The subtitle is
"Here Stephen Senn examines one of Galton’s most important statistical legacies – one that is at once so trivial that it is blindingly obvious, and so deep that many scientists spend their whole career being fooled by it."
The examples in this paper are extended in Senn (2009), “Three things that every medical writer should know about statistics”. The three things are regression to the mean, the error of the transposed conditional and individual response.
You can read slightly more technical accounts of regression to the mean in McDonald & Mazzuca (1983) "How much of the placebo effect is statistical regression" (two quotations from this paper opened this post), and in Stephen Senn (2015) "Mastering variation: variance components and personalised medicine". In 1988 Senn published some corrections to the maths in McDonald (1983).
The trials that were used by Hróbjartsson & Gøtzsche (2010) to investigate the comparison between placebo and no treatment were looked at again by Howick et al., (2013), who found that in many of them the difference between treatment and placebo was also small. Most of the treatments did not work very well.
Regression to the mean is not just a medical deceiver: it’s everywhere
Although this post has concentrated on deception in medicine, it’s worth noting that the phenomenon of regression to the mean can cause wrong inferences in almost any area where you look at change from baseline. A classical example concern concerns the effectiveness of speed cameras. They tend to be installed after a spate of accidents, and if the accident rate is particularly high in one year it is likely to be lower the next year, regardless of whether a camera had been installed or not. To find the true reduction in accidents caused by installation of speed cameras, you would need to choose several similar sites and allocate them at random to have a camera or no camera. As in clinical trials. looking at the change from baseline can be very deceptive.
Statistical postscript
Lastly, remember that it you avoid all of these hazards of interpretation, and your test of significance gives P = 0.047. that does not mean you have discovered something. There is still a risk of at least 30% that your ‘positive’ result is a false positive. This is explained in Colquhoun (2014),"An investigation of the false discovery rate and the misinterpretation of p-values". I’ve suggested that one way to solve this problem is to use different words to describe P values: something like this.
|
P > 0.05 very weak evidence
P = 0.05 weak evidence: worth another look P = 0.01 moderate evidence for a real effect P = 0.001 strong evidence for real effect |
But notice that if your hypothesis is implausible, even these criteria are too weak. For example, if the treatment and placebo are identical (as would be the case if the treatment were a homeopathic pill) then it follows that 100% of positive tests are false positives.
Follow-up
12 December 2015
It’s worth mentioning that the question of responders versus non-responders is closely-related to the classical topic of bioassays that use quantal responses. In that field it was assumed that each participant had an individual effective dose (IED). That’s reasonable for the old-fashioned LD50 toxicity test: every animal will die after a sufficiently big dose. It’s less obviously right for ED50 (effective dose in 50% of individuals). The distribution of IEDs is critical, but it has very rarely been determined. The cumulative form of this distribution is what determines the shape of the dose-response curve for fraction of responders as a function of dose. Linearisation of this curve, by means of the probit transformation used to be a staple of biological assay. This topic is discussed in Chapter 10 of Lectures on Biostatistics. And you can read some of the history on my blog about Some pharmacological history: an exam from 1959.
There is a widespread belief that science is going through a crisis of reproducibility. A meeting was held to discuss the problem. It was organised by Academy of Medical Sciences, the Wellcome Trust, MRC and BBSRC, and It was chaired by Dorothy Bishop (of whose blog I’m a huge fan). It’s good to see that scientific establishment is beginning to take notice. Up to now it’s been bloggers who’ve been making the running. I hadn’t intended to write a whole post about it, but some sufficiently interesting points arose that I’ll have a go.
The first point to make is that, as far as I know, the “crisis” is limited to, or at least concentrated in, quite restricted areas of science. In particular, it doesn’t apply to the harder end of sciences. Nobody in physics, maths or chemistry talks about a crisis of reproducibility. I’ve heard very little about irreproducibility in electrophysiology (unless you include EEG work). I’ve spent most of my life working on single-molecule biophysics and I’ve never encountered serious problems with irreproducibility. It’s a small and specialist field so I think if I would have noticed if it were there. I’ve always posted on the web our analysis programs, and if anyone wants to spend a year re-analysing it they are very welcome to do so (though I have been asked only once).
The areas that seem to have suffered most from irreproducibility are experimental psychology, some areas of cell biology, imaging studies (fMRI) and genome studies. Clinical medicine and epidemiology have been bad too. Imaging and genome studies seem to be in a slightly different category from the others. They are largely statistical problems that arise from the huge number of comparisons that need to be done. Epidemiology problems stem largely from a casual approach to causality. The rest have no such excuses.
The meeting was biased towards psychology, perhaps because that’s an area that has had many problems. The solutions that were suggested were also biased towards that area. It’s hard to see some of them could be applied to electrophysiology for example.
There was, it has to be said, a lot more good intentions than hard suggestions. Pre-registration of experiments might help a bit in a few areas. I’m all for open access and open data, but doubt they will solve the problem either, though I hope they’ll become the norm (they always have been for me).
All the tweets from the meeting hve been collected as a Storify. The most retweeted comment was from Liz Wager
@SideviewLiz: Researchers are incentivised to publish, get grants, get promoted but NOT incentivised to be right! #reprosymp
This, I think, cuts to the heart if the problem. Perverse incentives, if sufficiently harsh, will inevitably lead to bad behaviour. Occasionally it will lead to fraud. It’s even led to (at least) two suicides. If you threaten people in their forties and fifties with being fired, and losing their house, because they don’t meet some silly metric, then of course people will cut corners. Curing that is very much more important than pre-registration, data-sharing and concordats, though the latter occupied far more of the time at the meeting.
The primary source of the problem is that there is not enough money for the number of people who want to do research (a matter that was barely mentioned). That leads to the unpalatable conclusion that the only way to cure the problem is to have fewer people competing for the money. That’s part of the reason that I suggested recently a two-stage university system. That’s unlikely to happen soon. So what else can be done in the meantime?
The responsibility for perverse incentives has to rest squarely on the shoulders of the senior academics and administrators who impose them. It is at this level that the solutions must be found. That was said, but not firmly enough. The problems are mostly created by the older generation It’s our fault.
IncidentalIy, I was not impressed by the fact that the Academy of Medical Sciences listed attendees with initials after peoples’ names. There were eight FRSs but I find it a bit embarrassing to be identified as one, as though it made any difference to the value of what I said.
It was suggested that courses in research ethics for young scientists would help. I disagree. In my experience, young scientists are honest and idealistic. The problems arise when their idealism is shattered by the bad example set by their elders. I’ve had a stream of young people in my office who want advice and support because they feel they are being pressured by their elders into behaviour which worries them. More than one of them have burst into tears because they feel that they have been bullied by PIs.
One talk that I found impressive was Ottloline Leyser who chaired the recent report on The Culture of Scientific Research in the UK, from the Nuffield Council on Bioethics. But I found that report to be bland and its recommendations, though well-meaning, unlikely to result in much change. The report was based on a relatively small, self-selected sample of 970 responses to a web survey, and on 15 discussion events. Relatively few people seem to have spent time filling in the text boxes, For example
“Of the survey respondents who provided a negative comment on the effects of competition in science, 24 out of 179 respondents (13 per cent) believe that high levels of competition between individuals discourage research collaboration and the sharing of data and methodologies.&rdquo:
Such numbers are too small to reach many conclusions, especially since the respondents were self-selected rather than selected at random (poor experimental design!). Nevertheless, the main concerns were all voiced. I was struck by
“Almost twice as many female survey respondents as male respondents raise issues related to career progression and the short term culture within UK research when asked which features of the research environment are having the most negative effect on scientists”
But no conclusions or remedies were put forward to remedy this problem. It was all put rather better, and much more frankly, some time ago by Peter Lawrence. I do have the impression that bloggers (including Dorothy Bishop) get to the heart of the problems much more directly than any official reports.
The Nuffield report seemed to me to put excessive trust in paper exercises, such as the “Concordat to Support the Career Development of Researchers”. The word “bullying” does not occur anywhere in the Nuffield document, despite the fact that it’s problem that’s been very widely discussed and a problem that’s critical for the problems of reproducibility. The Concordat (unlike the Nuffield report) does mention bullying.
"All managers of research should ensure that measures exist at every institution through which discrimination, bullying or harassment can be reported and addressed without adversely affecting the careers of innocent parties. "
That sounds good, but it’s very obvious that there are many places simply ignore it. All universities subscribe to the Concordat. But signing is as far as it goes in too many places. It was signed by Imperial College London, the institution with perhaps the worst record for pressurising its employees, but official reports would not dream of naming names or looking at publicly available documentation concerning bullying tactics. For that, you need bloggers.
On the first day, the (soon-to-depart) Dean of Medicine at Imperial, Dermot Kelleher, was there. He seemed a genial man, but he would say nothing about the death of Stefan Grimm. I find that attitude incomprehensible. He didn’t reappear on the second day of the meeting.
The San Francisco Declaration on Research Assessment (DORA) is a stronger statement than the Concordat, but its aims are more limited. DORA states that the impact factor is not to be used as a substitute “measure of the quality of individual research articles, or in hiring, promotion, or funding decisions”. That’s something that I wrote about in 2003, in Nature. In 2007 it was still rampant, including at Imperial College. It still is in many places. The Nuffield Council report says that DORA has been signed by “over 12,000 individuals and 500 organisations”, but fails to mention the fact that only three UK universities have signed up to DORA (oneof them, I’m happy to say, is UCL). That’s a pretty miserable record. And, of course, it remains to be seen whether the signatories really abide by the agreement. Most such worthy agreements are ignored on the shop floor.
The recommendations of the Nuffield Council report are all worthy, but they are bland and we’ll be lucky if they have much effect. For example
“Ensure that the track record of researchers is assessed broadly, without undue reliance on journal impact factors”
What on earth is “undue reliance”? That’s a far weaker statement than DORA. Why?
And
“Ensure researchers, particularly early career researchers, have a thorough grounding in research ethics”
In my opinion, what we should say to early career researchers is “avoid the bad example that’s set by your elders (but not always betters)”. It’s the older generation which has produced the problems and it’s unbecoming to put the blame on the young. It’s the late career researchers who are far more in need of a thorough grounding in research ethics than early-career researchers.
Although every talk was more or less interesting, the one I enjoyed most was the first one, by Marcus Munafo. It assessed the scale of the problem (though with a strong emphasis on psychology, plus some genetics and epidemiology), and he had good data on under-powered studies. It also made a fleeting mention of the problem of the false discovery rate. Since the meeting was essentially about the publication of results that aren’t true, I would have expected the statistical problem of the false discovery rate to have been given much more prominence than it was. Although Ioannidis’ now-famous paper “Why most published research is wrong” got the occasional mention, very little attention (apart from Munafo and Button) was given to the problems which he pointed out.
I’ve recently convinced myself that, if you declare that you’ve made a discovery when you observe P = 0.047 (as is almost universal in the biomedical literature) you’ll be wrong 30 – 70% of the time (see full paper, "An investigation of the false discovery rate and the misinterpretation of p-values".and simplified versions on Youtube and on this blog). If that’s right, then surely an important way to reduce the publication of false results is for journal editors to give better advice about statistics. This is a topic that was almost absent from the meeting. It’s also absent from the Nuffield Council report (the word “statistics” does not occur anywhere).
In summary, the meeting was very timely, and it was fun. But I ended up thinking it had a bit too much of preaching good intentions to the converted. It failed to grasp some of the nettles firmly enough. There was no mention of what’s happening at Imperial, or Warwick, or Queen Mary, or at Kings College London. Let’s hope that when it’s written up, the conclusion will be a bit less bland than those of most official reports.
It’s overdue that we set our house in order, because the public has noticed what’s going on. The New York Times was scathing in 2006. This week’s Economist said
"Modern scientists are doing too much trusting and not enough verifying -to the detriment of the whole of science, and of humanity.
Too many of the findings that fill the academic ether are the result of shoddy experiments or poor analysis""Careerism also encourages exaggeration and the cherrypicking of results."
This is what the public think of us. It’s time that vice-chancellors did something about it, rather than willy-waving about rankings.
Conclusions
After criticism of the conclusions of official reports, I guess that I have to make an attempt at recommendations myself. Here’s a first attempt.
- The heart of the problem is money. Since the total amount of money is not likely to increase in the short term, the only solution is to decrease the number of applicants. This is a real political hot-potato, but unless it’s tackled the problem will persist. The most gentle way that I can think of doing this is to restrict research to a subset of universities. My proposal for a two stage university system might go some way to achieving this. It would result in better postgraduate education, and it would be more egalitarian for students. But of course universities that became “teaching only” would see (wrongly) as demotion, and it seems that UUK is unlikely to support any change to the status quo (except, of course, for increasing fees).
- Smaller grants, smaller groups and fewer papers would benefit science.
- Ban completely the use of impact factors and discourage use of all metrics. None has been shown to measure future quality. All increase the temptation to “game the system” (that’s the usual academic euphemism for what’s called cheating if an undergraduate does it).
- “Performance management” is the method of choice for bullying academics. Don’t allow people to be fired because they don’t achieve arbitrary targets for publications or grant income. The criteria used at Queen Mary London, and Imperial, and Warwick and at Kings, are public knowledge. They are a recipe for employing spivs and firing Nobel Prize winners: the 1991 Nobel Laureate in Physiology or Medicine would have failed Imperial’s criteria in 6 years out of 10 years when he was doing the work which led to the prize.
- Universities must learn that if you want innovation and creativity you have also to tolerate a lot of failure.
- The ranking of universities by ranking businesses or by the REF encourages bad behaviour by encouraging vice-chancellors to improve their ranking, by whatever means they can. This is one reason for bullying behaviour. The rankings are totally arbitrary and a huge waste of money. I’m not saying that universities should be unaccountable to taxpayers. But all you have to do is to produce a list of publications to show that very few academics are not trying. It’s absurd to try to summarise a whole university in a single number. It’s simply statistical illiteracy
- Don’t waste money on training courses in research ethics. Everyone already knows what’s honest and what’s dodgy (though a bit more statistics training might help with that). Most people want to do the honest thing, but few have the nerve to stick to their principles if the alternative is to lose your job and your home. Senior university people must stop behaving in that way.
- University procedures for protecting the young are totally inadequate. A young student who reports bad behaviour of his seniors is still more likely to end up being fired than being congratulated (see, for example, a particularly bad case at the University of Sheffield). All big organisations close ranks to defend themselves when criticised. Even extreme cases, as when an employee commits suicide after being bullied, universities issue internal reports which blame nobody.
- Universities must stop papering over the cracks when misbehaviour is discovered. It seems to be beyond the wit of PR people to realise that often it’s best (and always the cheapest) to put your hands up and say “sorry, we got that wrong”
- There an urgent need to get rid of the sort of statistical illiteracy that allows P = 0.06 to be treated as failure and P = 0.04 as success. This is almost universal in biomedical papers, and given the hazards posed by the false discovery rate, could well be a major contribution to false claims. Journal editors need to offer much better statistical advice than is the case at the moment.