Download Lectures on Biostatistics (1971). Corrected and searchable version of Google books edition
Download review of Lectures on Biostatistics (THES, 1973).
WCRF
This article has been reposted on The Winnower, and now has a digital object identifier DOI: 10.15200/winn.142934.47856
This post is not about quackery, nor university politics. It is about inference, How do we know what we should eat? The question interests everyone, but what do we actually know? Not as much as you might think from the number of column-inches devoted to the topic. The discussion below is a synopsis of parts of an article called “In praise of randomisation”, written as a contribution to a forthcoming book, Evidence, Inference and Enquiry.
About a year ago just about every newspaper carried a story much like this one in the Daily Telegraph,
|
Sausage a day can increase bowel cancer risk By Rebecca Smith, Medical Editor Last Updated: 1:55AM BST 31/03/2008
|
||||
What, I wondered, was the evidence behind these dire warnings. They did not come from a lifestyle guru, a diet faddist or a supplement salesman. This is nothing to do with quackery. The numbers come from the 2007 report of the World Cancer Research Fund and American Institute for Cancer Research, with the title ‘Food, Nutrition, Physical Activity, and the Prevention of Cancer: a Global Perspective‘. This is a 537 page report with over 4,400 references. Its panel was chaired by Professor Sir Michael Marmot, UCL’s professor of Epidemiology and Public Health. He is a distinguished epidemiologist, renowned for his work on the relation between poverty and health.
Nevertheless there has never been a randomised trial to test the carcinogenicity of bacon, so it seems reasonable to ask how strong is the evidence that you shouldn’t eat it? It turns out to be surprisingly flimsy.
In praise of randomisation
Everyone knows about the problem of causality in principle. Post hoc ergo propter hoc; confusion of sequence and consequence; confusion of correlation and cause. This is not a trivial problem. It is probably the main reason why ineffective treatments often appear to work. It is traded on by the vast and unscrupulous alternative medicine industry. It is, very probably, the reason why we are bombarded every day with conflicting advice on what to eat. This is a bad thing, for two reasons. First, we end up confused about what we should eat. But worse still, the conflicting nature of the advice gives science as a whole a bad reputation. Every time a white-coated scientist appears in the media to tell us that a glass of wine per day is good/bad for us (delete according to the phase of the moon) the general public just laugh.
In the case of sausages and bacon, suppose that there is a correlation between eating them and developing colorectal cancer. How do we know that it was eating the bacon that caused the cancer – that the relationship is causal? The answer is that there is no way to be sure if we have simply observed the association. It could always be that the sort of people who eat bacon are also the sort of people who get colorectal cancer. But the question of causality is absolutely crucial, because if it is not causal, then stopping eating bacon won’t reduce your risk of cancer. The recommendation to avoid all processed meat in the WCRF report (2007) is sensible only if the relationship is causal. Barker Bausell said:
[Page39] “But why should nonscientists care one iota about something as esoteric as causal inference? I believe that the answer to this question is because the making of causal inferences is part of our job description as Homo Sapiens.”
That should be the mantra of every health journalist, and every newspaper reader.
|
The essential basis for causal inference was established over 70 years ago by that giant of statistics Ronald Fisher, and that basis is randomisation. Its first popular exposition was in Fisher’s famous book, The Design of Experiments (1935). The Lady Tasting Tea has become the classical example of how to design an experiment. . |
|
Briefly, a lady claims to be able to tell whether the milk was put in the cup before or after the tea was poured. Fisher points out that to test this you need to present the lady with an equal number of cups that are ‘milk first’ or ‘tea first’ (but otherwise indistinguishable) in random order, and count how many she gets right. There is a beautiful analysis of it in Stephen Senn’s book, Dicing with Death: Chance, Risk and Health. As it happens, Google books has the whole of the relevant section Fisher’s tea test (geddit?), but buy the book anyway. Such is the fame of this example that it was used as the title of a book, The Lady Tasting Tea was published by David Salsburg (my review of it is here)
Most studies of diet and health fall into one of three types, case-control studies, cohort (or prospective) studies, or randomised controlled trials (RCTs). Case-control studies are the least satisfactory: they look at people who already have the disease and look back to see how they differ from similar people who don’t have the disease. They are retrospective. Cohort studies are better because they are prospective: a large group of people is followed for a long period and their health and diet is recorded and later their disease and death is recorded. But in both sorts of studies,each person decides for him/herself what to eat or what drugs to take. Such studies can never demonstrate causality, though if the effect is really big (like cigarette-smoking and lung cancer) they can give a very good indication. The difference in an RCT is that each person does not choose what to eat, but their diet is allocated randomly to them by someone else. This means that, on average, all other factors that might influence the response are balanced equally between the two groups. Only RCTs can demonstrate causality.
Randomisation is a rather beautiful idea. It allows one to remove, in a statistical sense, bias that might result from all the sources that you hadn’t realised were there. If you are aware of a source of bias, then measure it. The danger arises from the things you don’t know about, or can’t measure (Senn, 2004; Senn, 2003). Although it guarantees freedom from bias only in a long run statistical sense, that is the best that can be done. Everything else is worse.
Ben Goldacre has referred memorably to the newspapers’ ongoing “Sisyphean task of dividing all the inanimate objects in the world into the ones that either cause or cure cancer” (Goldacre, 2008). This has even given rise to a blog. “The Daily Mail Oncological Ontology Project“. The problem arises in assessing causality.
It wouldn’t be so bad if the problem were restricted to the media. It is much more worrying that the problem of establishing causality often seems to be underestimated by the authors of papers themselves. It is a matter of speculation why this happens. Part of the reason is, no doubt, a genuine wish to discover something that will benefit mankind. But it is hard not to think that hubris and self-promotion may also play a role. Anything whatsoever that purports to relate diet to health is guaranteed to get uncritical newspaper headlines.
At the heart of the problem lies the great difficulty in doing randomised studies of the effect of diet and health. There can be no better illustration of the vital importance of randomisation than in this field. And, notwithstanding the generally uncritical reporting of stories about diet and health, one of the best accounts of the need for randomisation was written by a journalist, Gary Taubes, and it appeared in the New York Times (Taubes, 2007).
The case of hormone replacement therapy
In the 1990s hormone replacement therapy (HRT) was recommended not only to relieve the unpleasant symptoms of the menopause, but also because cohort studies suggested that HRT would reduce heart disease and osteoporosis in older women. For these reasons, by 2001, 15 million US women (perhaps 5 million older women) were taking HRT (Taubes, 2007). These recommendations were based largely on the Harvard Nurses’ Study. This was a prospective cohort study in which 122,000 nurses were followed over time, starting in 1976 (these are the ones who responded out of the 170,000 requests sent out). In 1994, it was said (Manson, 1994) that nearly all of the more than 30 observational studies suggested a reduced risk of coronary heart disease (CHD) among women receiving oestrogen therapy. A meta-analysis gave an estimated 44% reduction of CHD. Although warnings were given about the lack of randomised studies, the results were nevertheless acted upon as though they were true. But they were wrong. When proper randomised studies were done, not only did it turn out that CHD was not reduced: it was actually increased.
The Women’s Health Initiative Study (Rossouw et al., 2002) was a randomized double blind trial on 16,608 postmenopausal women aged 50-79 years and its results contradicted the conclusions from all the earlier cohort studies. HRT increased risks of heart disease, stroke, blood clots, breast cancer (though possibly helped with osteoporosis and perhaps colorectal cancer). After an average 5.2 years of follow-up, the trial was stopped because of the apparent increase in breast cancer in the HRT group. The relative risk (HRT relative to placebo) of CHD was 1.29 (95% confidence interval 1.02 to 1.63) (286 cases altogether) and for breast cancer 1.26 (1.00 -1.59) (290 cases). Rather than there being a 44% reduction of risk, it seems that there was actually a 30% increase in risk. Notice that these are actually quite small risks, and on the margin of statistical significance. For the purposes of communicating the nature of the risk to an individual person it is usually better to specify the absolute risk rather than relative risk. The absolute number of CHD cases per 10,000 person-years is about 29 on placebo and 36 on HRT, so the increased risk of any individual is quite small. Multiplied over the whole population though, the number is no longer small.
Several plausible reasons for these contradictory results are discussed by Taubes,(2007): it seems that women who choose to take HRT are healthier than those who don’t. In fact the story has become a bit more complicated since then: the effect of HRT depends on when it is started and on how long it is taken (Vandenbroucke, 2009).
This is perhaps one of the most dramatic illustrations of the value of randomised controlled trials (RCTs). Reliance on observations of correlations suggested a 44% reduction in CHD, the randomised trial gave a 30% increase in CHD. Insistence on randomisation is not just pedantry. It is essential if you want to get the right answer.
Having dealt with the cautionary tale of HRT, we can now get back to the ‘Sisyphean task of dividing all the inanimate objects in the world into the ones that either cause or cure cancer’.
The case of processed meat
The WCRF report (2007) makes some pretty firm recommendations.
- Don’t get overweight
- Be moderately physically active, equivalent to brisk walking for at least 30 minutes every day
- Consume energy-dense foods sparingly. Avoid sugary drinks. Consume ‘fast foods’ sparingly, if at all
- Eat at least five portions/servings (at least 400 g or 14 oz) of a variety of non-starchy vegetables and of fruits every day. Eat relatively unprocessed cereals (grains) and/or pulses (legumes) with every meal. Limit refined starchy foods
- People who eat red meat to consume less than 500 g (18 oz) a week, very little if any to be processed.
- If alcoholic drinks are consumed, limit consumption to no more than two drinks a day for men and one drink a day for women.
- Avoid salt-preserved, salted, or salty foods; preserve foods without using salt. Limit consumption of processed foods with added salt to ensure an intake of less than 6 g (2.4 g sodium) a day.
- Dietary supplements are not recommended for cancer prevention.
These all sound pretty sensible but they are very prescriptive. And of course the recommendations make sense only insofar as the various dietary factors cause cancer. If the association is not causal, changing your diet won’t help. Note that dietary supplements are NOT recommended. I’ll concentrate on the evidence that lies behind “People who . . . very little if any to be processed.”
The problem of establishing causality is dicussed in the report in detail. In section 3.4 the report says
” . . . causal relationships between food and nutrition, and physical activity can be confidently inferred when epidemiological evidence, and experimental and other biological findings, are consistent, unbiased, strong, graded, coherent, repeated, and plausible.”
The case of processed meat is dealt with in chapter 4.3 (p. 148) of the report.
“Processed meats” include sausages and frankfurters, and ‘hot dogs’, to which nitrates/nitrites or other preservatives are added, are also processed meats. Minced meats sometimes, but not always, fall inside this definition if they are preserved chemically. The same point applies to ‘hamburgers’.
The evidence for harmfulness of processed meat was described as “convincing”, and this is the highest level of confidence in the report, though this conclusion has been challenged (Truswell, 2009) .
How well does the evidence obey the criteria for the relationship being causal?
Twelve prospective cohort studies showed increased risk for the highest intake group when compared to the lowest, though this was statistically significant in only three of them. One study reported non-significant decreased risk and one study reported that there was no effect on risk. These results are summarised in this forest plot (see also Lewis & Clark, 2001)
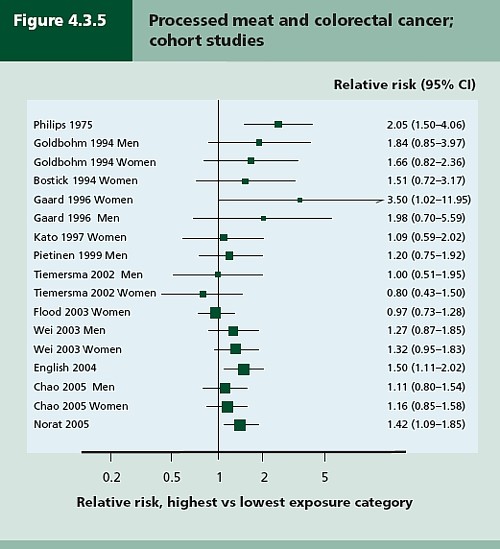
Each line represents a separate study. The size of the square represents the precision (weight) for each. The horizontal bars show the 95% confidence intervals. If it were possible to repeat the observations many times on the same population, the 95% CL would be different on each repeat experiment, but 19 out of 20 (95%) of the intervals would contain the true value (and 1 in 20 would not contain the true value). If the bar does not overlap the vertical line at relative risk = 1 (i.e. no effect) this is equivalent to saying that there is a statistically significant difference from 1 with P < 0.05. That means, very roughly, that there is a 1 in 20 chance of making a fool of yourself if you claim that the association is real, rather than being a result of chance (more detail here),
There is certainly a tendency for the relative risks to be above one, though not by much, Pooling the results sounds like a good idea. The method for doing this is called meta-analysis .
Meta-analysis was possible on five studies, shown below. The outcome is shown by the red diamond at the bottom, labelled “summary effect”, and the width of the diamond indicates the 95% confidence interval. In this case the final result for association between processed meat intake and colorectal cancer was a relative risk of 1.21 (95% CI 1.04–1.42) per 50 g/day. This is presumably where the headline value of a 20% increase in risk came from.
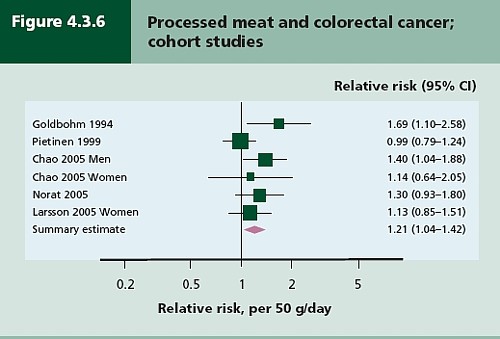
Support came from a meta-analysis of 14 cohort studies, which reported a relative risk for processed meat of 1.09 (95% CI 1.05 – 1.13) per 30 g/day (Larsson & Wolk, 2006). Since then another study has come up with similar numbers (Sinha etal. , 2009). This consistency suggests a real association, but it cannot be taken as evidence for causality. Observational studies on HRT were just as consistent, but they were wrong.
The accompanying editorial (Popkin, 2009) points out that there are rather more important reasons to limit meat consumption, like the environmental footprint of most meat production, water supply, deforestation and so on.
So the outcome from vast numbers of observations is an association that only just reaches the P = 0.05 level of statistical significance. But even if the association is real, not a result of chance sampling error, that doesn’t help in the least in establishing causality.
There are two more criteria that might help, a good relationship between dose and response, and a plausible mechanism.
Dose – response relationship
|
It is quite possible to observe a very convincing relationship between dose and response in epidemiological studies, The relationship between number of cigarettes smoked per day and the incidence of lung cancer is one example. Indeed it is almost the only example. |
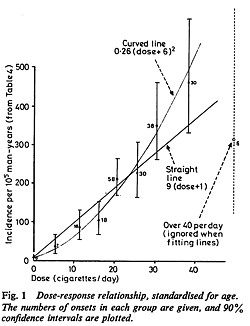 Doll & Peto, 1978 |
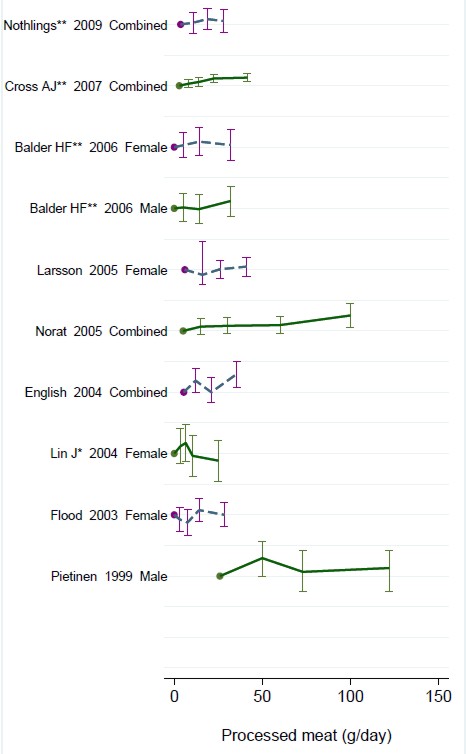
There have been six studies that relate consumption of processed meat to incidence of colorectal cancer. All six dose-response relationships are shown in the WCRG report. Here they are.
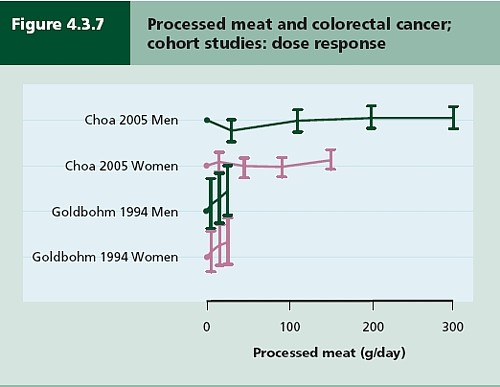
This Figure was later revised to
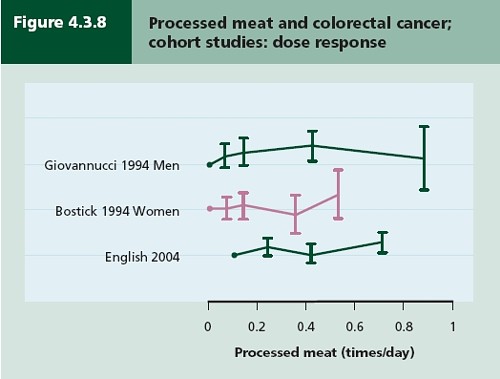
This is the point where my credulity begins to get strained. Dose – response curves are part of the stock in trade of pharmacologists. The technical description of these six curves is, roughly, ‘bloody horizontal’. The report says “A dose-response relationship was also apparent from cohort studies that measured consumption in times/day”. I simply cannot agree that any relationship whatsoever is “apparent”.
They are certainly the least convincing dose-response relationships I have ever seen. Nevertheless a meta-analysis came up with a slope for response curve that just reached the 5% level of statistical significance.
The conclusion of the report for processed meat and colorectal cancer was as follows.
“There is a substantial amount of evidence, with a dose-response relationship apparent from cohort studies. There is strong evidence for plausible mechanisms operating in humans. Processed meat is a convincing cause of colorectal cancer.”
But the dose-response curves look appalling, and it is reasonable to ask whether public policy should be based on a 1 in 20 chance of being quite wrong (1 in 20 at best –see Senn, 2008). I certainly wouldn’t want to risk my reputation on odds like that, never mind use it as a basis for public policy.
So we are left with plausibility as the remaining bit of evidence for causality. Anyone who has done much experimental work knows that it is possible to dream up a plausible explanation of any result whatsoever. Most are wrong and so plausibility is a pretty weak argument. Much play is made of the fact that cured meats contain nitrates and nitrites, but there is no real evidence that the amount they contain is harmful.
The main source of nitrates in the diet is not from meat but from vegetables (especially green leafy vegetables like lettuce and spinach) which contribute 70 – 90% of total intake. The maximum legal content in processed meat is 10 – 25 mg/100g, but lettuce contains around 100 – 400 mg/100g with a legal limit of 200 – 400 mg/100g. Dietary nitrate intake was not associated with risk for colorectal cancer in two cohort studies.(Food Standards Agency, 2004; International Agency for Research on Cancer, 2006).
To add further to the confusion, another cohort study on over 60,000 people compared vegetarians and meat-eaters. Mortality from circulatory diseases and mortality from all causes were not detectably different between vegetarians and meat eaters (Key et al., 2009a). Still more confusingly, although the incidence of all cancers combined was lower among vegetarians than among meat eaters, the exception was colorectal cancer which had a higher incidence in vegetarians than in meat eaters (Key et al., 2009b).
Mente et al. (2009) compared cohort studies and RCTs for effects of diet on risk of coronary heart disease. “Strong evidence” for protective effects was found for intake of vegetables, nuts, and “Mediterranean diet”, and harmful effects of intake of trans–fatty acids and foods with a high glycaemic index. There was also a bit less strong evidence for effects of mono-unsaturated fatty acids and for intake of fish, marine ω-3 fatty acids, folate, whole grains, dietary vitamins E and C, beta carotene, alcohol, fruit, and fibre. But RCTs showed evidence only for “Mediterranean diet”, and for none of the others.
As a final nail in the coffin of case control studies, consider pizza. According to La Vecchia & Bosetti (2006), data from a series of case control studies in northern Italy lead to: “An inverse association was found between regular pizza consumption (at least one portion of pizza per week) and the risk of cancers of the digestive tract, with relative risks of 0.66 for oral and pharyngeal cancers, 0.41 for oesophageal, 0.82 for laryngeal, 0.74 for colon and 0.93 for rectal cancers.”
What on earth is one meant to make of this? Pizza should be prescribable on the National Health Service to produce a 60% reduction in oesophageal cancer? As the authors say “pizza may simply represent a general and aspecific indicator of a favourable Mediterranean diet.” It is observations like this that seem to make a mockery of making causal inferences from non-randomised studies. They are simply uninterpretable.
Is the observed association even real?
The most noticeable thing about the effects of red meat and processed meat is not only that they are small but also that they only just reach the 5 percent level of statistical significance. It has been explained clearly why, in these circumstances, real associations are likely to be exaggerated in size (Ioannidis, 2008a; Ioannidis, 2008b; Senn, 2008). Worse still, there as some good reasons to think that many (perhaps even most) of the effects that are claimed in this sort of study are not real anyway (Ioannidis, 2005). The inflation of the strength of associations is expected to be bigger in small studies, so it is noteworthy that the large meta-analysis by Larsson & Wolk, 2006 comments “In the present meta-analysis, the magnitude of the relationship of processed meat consumption with colorectal cancer risk was weaker than in the earlier meta-analyses”.
This is all consistent with the well known tendency of randomized clinical trials to show initially a good effect of treatment but subsequent trials tend to show smaller effects. The reasons, and the cures, for this worrying problem are discussed by Chalmers (Chalmers, 2006; Chalmers & Matthews, 2006; Garattini & Chalmers, 2009)
What do randomized studies tell us?
The only form of reliable evidence for causality comes from randomised controlled trials. The difficulties in allocating people to diets over long periods of time are obvious and that is no doubt one reason why there are far fewer RCTs than there are observational studies. But when they have been done the results often contradict those from cohort studies. The RCTs of hormone replacement therapy mentioned above contradicted the cohort studies and reversed the advice given to women about HRT.
Three more illustrations of how plausible suggestions about diet can be refuted by RCTs concern nutritional supplements and weight-loss diets
Many RCTs have shown that various forms of nutritional supplement do no good and may even do harm (see Cochrane reviews). At least we now know that anti-oxidants per se do you no good. The idea that anti-oxidants might be good for you was never more than a plausible hypothesis, and like so many plausible hypotheses it has turned out to be a myth. The word anti-oxidant is now no more than a marketing term, though it remains very profitable for unscrupulous salesmen.
The randomised Women’s Health Initiative Dietary Modification Trial (Prentice et al., 2007; Prentice, 2007) showed minimal effects of dietary fat on cancer, though the conclusion has been challenged on the basis of the possible inaccuracy of reported diet (Yngve et al., 2006).
Contrary to much dogma about weight loss (Sacks et al., 2009) found no differences in weight loss over two years between four very different diets. They assigned randomly 811 overweight adults to one of four diets. The percentages of energy derived from fat, protein, and carbohydrates in the four diets were 20, 15, and 65%; 20, 25, and 55%; 40, 15, and 45%; and 40, 25, and 35%. No difference could be detected between the different diets: all that mattered for weight loss was the total number of calories. It should be added, though, that there were some reasons to think that the participants may not have stuck to their diets very well (Katan, 2009).
The impression one gets from RCTs is that the details of diet are not anything like as important as has been inferred from non-randomised observational studies.
So does processed meat give you cancer?
After all this, we can return to the original question. Do sausages or bacon give you colorectal cancer? The answer, sadly, is that nobody really knows. I do know that, on the basis of the evidence, it seems to me to be an exaggeration to assert that “The evidence is convincing that processed meat is a cause of bowel cancer”.
In the UK there were around 5 cases of colorectal cancer per 10,000 population in 2005, so a 20% increase, even if it were real, and genuinely causative. would result in 6 rather than 5 cases per 10,000 people, annually. That makes the risk sound trivial for any individual. On the other hand there were 36,766 cases of colorectal cancer in the UK in 2005. A 20% increase would mean, if the association were causal, about 7000 extra cases as a result of eating processed meat, but no extra cases if the association were not causal.
For the purposes of public health policy about diet, the question of causality is crucial. One has sympathy for the difficult decisions that they have to make, because they are forced to decide on the basis of inadequate evidence.
If it were not already obvious, the examples discussed above make it very clear that the only sound guide to causality is a properly randomised trial. The only exceptions to that are when effects are really big. The relative risk of lung cancer for a heavy cigarette smoker is 20 times that of a non-smoker and there is a very clear relationship between dose (cigarettes per day) and response (lung cancer incidence), as shown above. That is a 2000% increase in risk, very different from the 20% found for processed meat (and many other dietary effects). Nobody could doubt seriously the causality in that case.
The decision about whether to eat bacon and sausages has to be a personal one. It depends on your attitude to the precautionary principle. The observations do not, in my view, constitute strong evidence for causality, but they are certainly compatible with causality. It could be true so if you want to be on the safe side then avoid bacon. Of course life would not be much fun if your actions were based on things that just could be true.
My own inclination would be to ignore any relative risk based on observational data if it was less than about 2. The National Cancer Institute (Nelson, 2002) advises that relative risks less than 2 should be “viewed with caution”, but fails to explain what “viewing with caution” means in practice, so the advice isn’t very useful.
In fact hardly any of the relative risks reported in the WCRF report (2007) reach this level. Almost all relative risks are less than 1.3 (or greater than 0.7 for alleged protective effects). Perhaps it is best to stop worrying and get on with your life. At some point it becomes counterproductive to try to micromanage `people’s diet on the basis of dubious data. There is a price to pay for being too precautionary. It runs the risk of making people ignore information that has got a sound basis. It runs the risk of excessive medicalisation of everyday life. And it brings science itself into disrepute when people laugh at the contradictory findings of observational epidemiology.
The question of how diet and other ‘lifestyle interventions’ affect health is fascinating to everyone. There is compelling reason to think that it matters. For example one study demonstrated that breast cancer incidence increased almost threefold in first-generation Japanese women who migrated to Hawaii, and up to fivefold in the second generation (Kolonel, 1980). Since then enormous effort has been put into finding out why. The first great success was cigarette smoking but that is almost the only major success. Very few similar magic bullets have come to light after decades of searching (asbestos and mesothelioma, or UV radiation and skin cancer count as successes).
The WCRF report (2007) has 537 pages and over 4400 references and we still don’t know.
Sometimes I think we should say “I don’t know” rather more often.
More material
-
Listen to Ben Goldacre’s Radio 4 programmes. The Rise of the Lifetsyle Nutritionists. Part 1 and Part 2 (mp3 files), and at badscience.net.
-
Risk The Science and Politics of Fear, Dan Gardner. Virgin
Books, 2008 -
Some bookmarks about diet and supplements
Follow up
Dan Gardner, the author of Risk, seems to like the last line at least, according to his blog.
Report of the update, 2010
The 2010 report has been updated in WCRF/AICR Systematic Literature Review Continuous Update Project Report [big pdf file]. This includes studies up to May/June 2010.
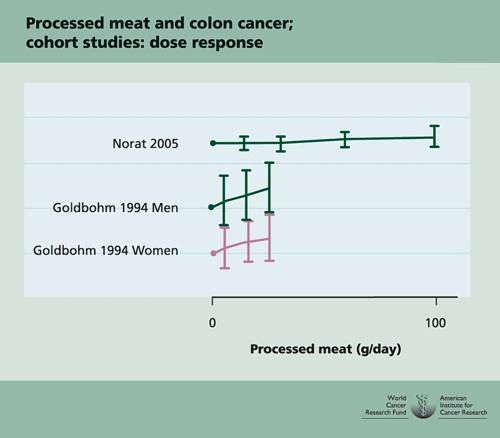
The result of addition of the new data was to reduce slightly the apparent risk from eating processed meat from 1.21 (95% CI = 1.04-1.42) in the original study to 1.18 (95% CI = 1.10-1.28) in the update. The change is too small to mean much, though it is in direction expected for false correlations. More importantly, the new data confirm that the dose-response curves are pathetic. The evidence for causality is weakened somewhat by addition of the new data.
Dose-response graph of processed meat and colorectal cancer