
Download Lectures on Biostatistics (1971). Corrected and searchable version of Google books edition
Download review of Lectures on Biostatistics (THES, 1973).
epidemiology
This example illustrates just how fast exponential growth is. It was proposed on twitter by Charles Arthur (@charlesarthur) who attributes the idea to Simon Moores. The stadium version is a variant of the better known ‘grains of wheat (or rice) on a chessboard‘ problem. The stadium example is better, I think, because the time element gives it a sense of urgency, and that’s what we need right now.

Here’s Wembley Stadium. The watering system develops a fault: in minute 1 one drop of water is released; minute 2, two drops, minute 3 four drops, and so on. Every minute the number of drops doubles. How long will it take to fill Wembley stadium?
The answer is that after 44 minutes, before half-time, the stadium would overflow.
Here’s why.
The sequence is 1, 2, 4, 8, 16, . . . so the nth term in the sequence is 2n – 1. For example, the 4th term is 23 = 8.
Next we need to know how many drops are needed to fill the stadium. Suppose a drop of water has a volume of 0.07 ml. This is 0.00000007, or 7 x 10⁻⁸, cubic metres. Wembley Stadium has a volume of 1.1 million cubic metres. So the stadium holds 15,714,285,714,285 drops. Or about 15.7×10¹² drops. How many minutes does it take to get to this volume of water?
After n minutes, the total volume of water will be the sum of all the drips up to that point. This turns out to be 2n-1. If this baffles you, check this video (in our case a =1 and r = 2).
We want to solve for n, the number of steps (minutes), 2n = 1 + 15.7×10¹². The easiest way to do this is to take the logarithm of both sides.
n log(2) = log(1 + 15.7×10¹²).
So
n = log(1 + 15.7×10¹²) / log(2) = 44.8 minutes
At the 43rd minute the stadium would be more than half full: (243 – 1) = 8.80 x 10¹², i.e. 56% of capacity.
By the 44th minute the stadium would have overflowed: (244 – 1) = 17.6 x 10¹², i.e. 112% of capacity.
Notice that (after the first few minutes) in the nth minute the volume released is equal to the total volume that’s already in, so at the 44th minute an extra 8.80 x 10¹² drops are dumped in. And at the 45th minute more than another stadium-full would appear.
The speed of the rise is truly terrifying.
Relationship of this to COVID-19
The rise in the number of cases, and of deaths, rises at first in a way similar to the rise in water level in Wembley stadium. The difference is that the time taken for the number to double is not one minute, but 2 – 3 days.
As of today, Monday 23rd March, both the number of diagnosed cases, and the number of deaths, in the UK are still rising exponentially. The situation in the UK now is almost exactly what it was in Italy 15 days ago. This from Inigo Martincorena (@imartincorena), shows it beautifully.


Boris Johnson’s weak and woolly approach will probably cost many thousands of lives and millions of pounds.
Up to now I’ve resisted the temptation to suggest that Whitty and Vallance might have been influenced by Dominic Cummings. After this revelation, in yesterday’s Sunday times, it’s getting progressively harder to believe that.

We have been self-isolated since March 12th, well before Johnson advised us it. It was obvious common sense.
Please stay at home and see nobody if you possible can.. This cartoon, by Toby Morris of thespinoff.co.nz, shows why.

Some good reading
The report from Imperial College, 16 March 2020, that seems to have influenced the government:
Tomas Pueyo. His piece on “Coronavirus: Why You Must Act Now“, dated March 10th, had 40 million views in a week
Tomas Pueyo. March 19th; What the Next 18 Months Can Look Like, if Leaders Buy Us Time.
“Some countries, like France, Spain or Philippines, have since ordered heavy lockdowns. Others, like the US, UK, or Switzerland, have dragged their feet, hesitantly venturing into social distancing measures.”
David Spiegelhalter. March 21st.
“So, roughly speaking, we might say that getting COVID-19 is like packing a year’s worth of risk into a week or two. Which is why it’s important to spread out the infections to avoid the NHS being overwhelmed.”
Washington Post. Some excellent animations March 14th
Up to date statistics. Worldometer is good (allows semi-log plots too).
The two posts on this blog about the hazards of s=ignificance testing have proved quite popular. See Part 1: the screening problem, and Part 2: Part 2: the false discovery rate. They’ve had over 20,000 hits already (though I still have to find a journal that will print the paper based on them).
Yet another Alzheiner’s screening story hit the headlines recently and the facts got sorted out in the follow up section of the screening post. If you haven’t read that already, it might be helpful to do so before going on to this post.
This post has already appeared on the Sense about Science web site. They asked me to explain exactly what was meant by the claim that the screening test had an "accuracy of 87%". That was mentioned in all the media reports, no doubt because it was the only specification of the quality of the test in the press release. Here is my attempt to explain what it means.
The "accuracy" of screening tests
Anything about Alzheimer’s disease is front line news in the media. No doubt that had not escaped the notice of Kings College London when they issued a press release about a recent study of a test for development of dementia based on blood tests. It was widely hailed in the media as a breakthrough in dementia research. For example, the BBC report is far from accurate). The main reason for the inaccurate reports is, as so often, the press release. It said
"They identified a combination of 10 proteins capable of predicting whether individuals with MCI would develop Alzheimer’s disease within a year, with an accuracy of 87 percent"
The original paper says
"Sixteen proteins correlated with disease severity and cognitive decline. Strongest associations were in the MCI group with a panel of 10 proteins predicting progression to AD (accuracy 87%, sensitivity 85% and specificity 88%)."
What matters to the patient is the probability that, if they come out positive when tested, they will actually get dementia. The Guardian quoted Dr James Pickett, head of research at the Alzheimer’s Society, as saying
"These 10 proteins can predict conversion to dementia with less than 90% accuracy, meaning one in 10 people would get an incorrect result."
That statement simply isn’t right (or, at least, it’s very misleading). The proper way to work out the relevant number has been explained in many places -I did it recently on my blog.
The easiest way to work it out is to make a tree diagram. The diagram is like that previously discussed here, but with a sensitivity of 85% and a specificity of 88%, as specified in the paper.
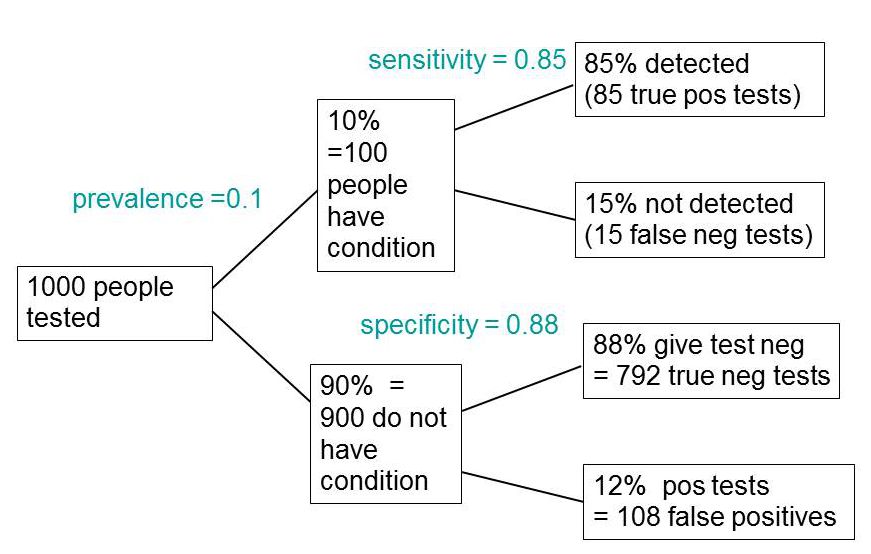
In order to work out the number we need, we have to specify the true prevalence of people who will develop dementia, in the population being tested. In the tree diagram, this has been taken as 10%. The diagram shows that, out of 1000 people tested, there are 85 + 108 = 193 with a positive test result. Out ot this 193, rather more than half (108) are false positives, so if you test positive there is a 56% chance that it’s a false alarm (108/193 = 0.56). A false discovery rate of 56% is far too high for a good test.
This figure of 56% seems to be the basis for a rather good post by NHS Choices with the title “Blood test for Alzheimer’s ‘no better than coin toss’
If the prevalence were taken as 5% (a value that’s been given for the over-60 age group) that fraction of false alarms would rise to a disastrous 73%.
How are these numbers related to the claim that the test is "87% accurate"? That claim was parroted in most of the media reports, and it is why Dr Pickett said "one in 10 people would get an incorrect result".
The paper itself didn’t define "accuracy" anywhere, and I wasn’t familiar with the term in this context (though Stephen Senn pointed out that it is mentioned briefly in the Wiikipedia entry for Sensitivity and Specificity). The senior author confirmed that "accuracy" means the total fraction of tests, positive or negative, that give the right result. We see from the tree diagram that, out of 1000 tests, there are 85 correct positive tests and 792 correct negative tests, so the accuracy (with a prevalence of 0.1) is (85 + 792)/1000 = 88%, close to the value that’s cited in the paper.
Accuracy, defined in this way, seems to me not to be a useful measure at all. It conflates positive and negative results and they need to be kept separate to understand the problem. Inspection of the tree diagram shows that it can be expressed algebraically as
accuracy = (sensitivity × prevalence) + (specificity × (1 − prevalence))
It is therefore merely a weighted mean of sensitivity and specificity (weighted by the prevalence). With the numbers in this case, it varies from 0.88 (when prevalence = 0) to 0.85 (when prevalence = 1). Thus it will inevitably give a much more flattering view of the test than the false discovery rate.
No doubt, it is too much to expect that a hard-pressed journalist would have time to figure this out, though it isn’t clear that they wouldn’t have time to contact someone who understands it. But it is clear that it should have been explained in the press release. It wasn’t.
In fact, reading the paper shows that the test was not being proposed as a screening test for dementia at all. It was proposed as a way to select patients for entry into clinical trials. The population that was being tested was very different from the general population of old people, being patients who come to memory clinics in trials centres (the potential trials population)
How best to select patients for entry into clinical trials is a matter of great interest to people who are running trials. It is of very little interest to the public. So all this confusion could have been avoided if Kings had refrained from issuing a press release at all, for a paper like this.
I guess universities think that PR is more important than accuracy.
That’s a bad mistake in an age when pretentions get quickly punctured on the web.
This post first appeared on the Sense about Science web site.
This article has been re-posted on The Winnower, so it now has a digital object identifier: DOI: 10.15200/winn.142935.50603
The latest news: eating red meat doesn’t do any harm. But why isn’t that said clearly? Alarmism makes better news, not only for journalists but for authors and university PR people too.
I’ve already written twice about red meat.
In May 2009 Diet and health. What can you believe: or does bacon kill you? based on the WCRF report (2007).
In March 2012 How big is the risk from eating red meat now? An update.
In the first of these I argued that the evidence produced by the World Cancer Research Fund (WCRF) for a causal relationship was very thin indeed. An update by WCRF in 2010 showed a slightly smaller risk, and weakened yet further the evidence for causality, though that wasn’t reflected in their press announcement.
The 2012 update added observations from two very large cohort studies. The result was that the estimates of risk were less than half as big as in 2009. The relative risk of dying from colorectal cancer was 1.21 (95% Confidence interval 1.04–1.42) with 50 g of red or processed meat per day, whereas in the new study the relative risk for cancer was only 1.10 (1.06-1.14) for a larger ‘dose’, 85 g of red meat. Again this good news was ignored and dire warnings were issued.
This reduction in size of the effect as samples get bigger is exactly what’s expected for spurious correlations, as described by Ioannidis and others. And it seems to have come true. The estimate of the harm done by red meat has vanished entirely in the latest study.
The EPIC study
This is the European Prospective Investigation into Cancer and Nutrition, another prospective cohort study, so it isn’t randomised [read the original paper]. And it was big, 448,568 people from ten different European countries. These people were followed for a median time of 12.7 years, and during follow-up 26,344 of them died.
The thing that was different about this paper was that red meat was found to pose no detectable risk, as judged by all-cause mortality. But this wasn’t even mentioned in the headline conclusions.
Conclusions: The results of our analysis support a moderate positive association between processed meat consumption and mortality, in particular due to cardiovascular diseases, but also to cancer.
To find the result you have to dig into Table 3.
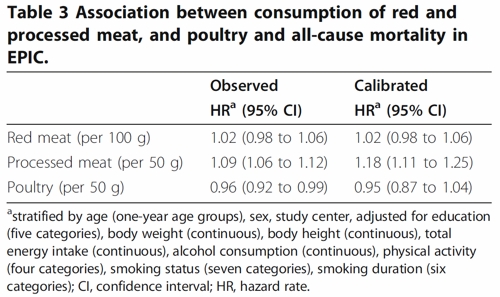
So, by both methods of calculation, the relative risk from eating red meat is negligible (except possibly in the top group, eating more than 160 g (7 oz) per day).
There is still an association between intake of processed meat and all-cause mortality, as in previous studies, though the association of processed meat with all-cause mortality, 1.09, or 1.18 depending on assumptions, is, if anything, smaller than was observed in the 2012 study, in which the relative risk was 1.20 (Table 2).
Assumptions, confounders and corrections.
The lowest meat eaters had only 13% of current smokers, but for the biggest red meat eaters it was 40%, for males. The alcohol consumption was 8.2 g/day for the lowest meat eaters but 23.4 g/day for the highest-meat group (the correlations were a bit smaller for women and also for processed meat eaters).
These two observations necessitate huge corrections to remove the (much bigger) effects of smoking and drinking if we want find the association for meat-eating alone. The main method for doing the correction is to fit the Cox proportional hazards model. This model assumes that there are straight-line relationships between the logarithm of the risk and the amount of each of the risk factors, e.g smoking, drinking, meat-eating and other risk factors. It may also include interactions that are designed to detect whether, for example, the effect of smoking on risk is or isn’t the same for people who drink different amounts.
Usually the straight-line assumption isn’t tested, and the results will depend on which risk factors (and which interactions between them) are included in the calculations. Different assumptions will give different answers. It simply isn’t known how accurate the corrections are when trying to eliminate the big effect of smoking in order to isolate the small effect of meat-eating. And that is before we get to other sorts of correction. For example, the relative risk from processed meat in Table 3, above, was 9% or 18% (1.09, or 1.18) depending on the outcome of a calculation that was intended to increase the accuracy of food intake records ("calibration").
The Conclusions of the new study don’t even mention the new result with red meat. All they mention is the risk from processed meat.
In this population, reduction of processed meat consumption to less than 20 g/day would prevent more than 3% of all deaths. As processed meat consumption is a modifiable risk factor, health promotion activities should include specific advice on lowering processed meat consumption.
Well, you would save that number of lives if, and only if, the processed meat was the cause of death. Too many epidemiologists, the authors pay lip service to the problem of causality in the introduction, but then go on to assume it in the conclusions. In fact the problem of causality isn’t even metnioned anywhere in either the 2012 study, or the new 2013 EPIC trial.
So is the risk of processed meat still real? Of course I can’t answer that. All that can be said is that it’s quite small, and as sample sizes get bigger, estimates of the risk are getting smaller. It wouldn’t be surprising if the risk from processed meat were eventually found not to exist, just as has happened for red (unprocessed) meat
The Japanese study
Last year there was another cohort study, with 51,683 Japanese. The results were even more (non-) dramatic [Nagao et al, 2012] than in the EPIC trial. This is how they summarise the results for the relative risks (with 95% confidence intervals).
"…for the highest versus lowest quintiles of meat consumption (77.6 versus 10.4 g/day) among men were 0.66 (0.45 — 0.97) for ischemic heart disease, 1.10 (0.84 — 1.43) for stroke and 1.00 (0.84 — 1.20) for total cardiovascular disease. The corresponding HRs (59.9 versus 7.5 g/day) among women were 1.22 (0.81 — 1.83), 0.91 (0.70 — 1.19) and 1.07 (0.90 — 1.28). The associations were similar when the consumptions of red meat, poultry, processed meat and liver were examined separately.
CONCLUSION: Moderate meat consumption, up to about 100 g/day, was not associated with increased mortality from ischemic heart disease, stroke or total cardiovascular disease among either gender."
In this study, the more meat (red or processed) you eat, the lower your risk of ischaemic heart disease (with the possible exception of overweight women). The risk of dying from any cardiovascular disease was unrelated to the amount of meat eaten (relative risk 1.0) whether processed meat or not.
Of course it’s possible that things which risky for Japanese people differ from those that are risky for Europeans. It’s also possible that even processed meat isn’t bad for you.
The carnitine study
The latest meat study to hit the headlines didn’t actually look at the effects of meat at all, though you wouldn’t guess that from the pictures of sausages in the headlines (not just in newspapers, but also in NHS Choices). The paper [reprint] was about carnitine, a substance that occurs particularly in beef, with lower amounts in pork and bacon, and in many other foods. The paper showed that bacteria in the gut can convert carnitine to a potentially toxic substance, trimethylamine oxide (TMAO). That harms blood vessels (at least in mice). But to show an effect in human subjects they were given an amount of carnitine equivalent to over 1 lb of steak, hardly normal, even in the USA.
The summary of the paper says it is an attempt to explain "the well-established link between high levels of red meat consumption and CVD [cardiovascular disease] risk". As we have just seen, it seems likely that this risk is far from being “well-established”. There is little or no such risk to explain.
It would be useful to have a diagnostic marker for heart disease, but this paper doesn’t show that carnitine or TMAO) is useful for that. It might also be noted that the authors have a maze of financial interests.
Competing financial interests Z.W. and B.S.L. are named as co-inventors on pending patents held by the Cleveland Clinic relating to cardiovascular diagnostics and have the right to receive royalty payments for inventions or discoveries related to cardiovascular diagnostics from Liposciences. W.H.W.T. received research grant support from Abbott Laboratories and served as a consultant for Medtronic and St. Jude Medical. S.L.H. and J.D.S. are named as co-inventors on pending and issued patents held by the Cleveland Clinic relating to cardiovascular diagnostics and therapeutics patents. S.L.H. has been paid as a consultant or speaker by the following companies: Cleveland Heart Lab., Esperion, Liposciences, Merck & Co. and Pfizer. He has received research funds from Abbott, Cleveland Heart Lab., Esperion and Liposciences and has the right to receive royalty payments for inventions or discoveries related to cardiovascular diagnostics from Abbott Laboratories, Cleveland Heart Lab., Frantz Biomarkers, Liposciences and Siemens.
The practical significance of this work was summed up the dietitian par excellence, Catherine Collins, on the BBC’s Inside Health programme.
Listen to Catherine Collins on carnitine.
She points out that the paper didn’t mean that we should change what we already think is a sensible diet.
At most, it suggests that it’s not a good idea to eat 1 lb steaks very day.
And the paper does suggest that it’s not sensible to take the carnitine supplements that are pushed by every gym. According to NIH
"twenty years of research finds no consistent evidence that carnitine supplements can improve exercise or physical performance in healthy subjects".
Carnitine supplements are a scam. And they could be dangerous.
Follow-up
Another blog on this topic, one from Cancer Research UK also fails to discuss the problem of causality. Neither does it go into the nature (and fallibility) of the corrections for counfounders like smoking and alcohol,. Nevertheless that, and an earlier post on Food and cancer: why media reports are often misleading, are a good deal more realistic than most newspaper reports.