
Download Lectures on Biostatistics (1971). Corrected and searchable version of Google books edition
Download review of Lectures on Biostatistics (THES, 1973).
This post is about why screening healthy people is generally a bad idea. It is the first in a series of posts on the hazards of statistics.
There is nothing new about it: Graeme Archer recently wrote a similar piece in his Telegraph blog. But the problems are consistently ignored by people who suggest screening tests, and by journals that promote their work. It seems that it can’t be said often enough.
The reason is that most screening tests give a large number of false positives. If your test comes out positive, your chance of actually having the disease is almost always quite small. False positive tests cause alarm, and they may do real harm, when they lead to unnecessary surgery or other treatments.
Tests for Alzheimer’s disease have been in the news a lot recently. They make a good example, if only because it’s hard to see what good comes of being told early on that you might get Alzheimer’s later when there are no good treatments that can help with that news. But worse still, the news you are given is usually wrong anyway.
Consider a recent paper that described a test for "mild cognitive impairment" (MCI), a condition that may, but often isn’t, a precursor of Alzheimer’s disease. The 15-minute test was published in the Journal of Neuropsychiatry and Clinical Neurosciences by Scharre et al (2014). The test sounded pretty good. It had a specificity of 95% and a sensitivity of 80%.
Specificity (95%) means that 95% of people who are healthy will get the correct diagnosis: the test will be negative.
Sensitivity (80%) means that 80% of people who have MCI will get the correct diagnosis: the test will be positive.
To understand the implication of these numbers we need to know also the prevalence of MCI in the population that’s being tested. That was estimated as 1% of people have MCI. Or, for over-60s only, 5% of people have MCI. Now the calculation is easy. Suppose 10.000 people are tested. 1% (100 people) will have MCI, of which 80% (80 people) will be diagnosed correctly. And 9,900 do not have MCI, of which 95% will test negative (correctly). The numbers can be laid out in a tree diagram.
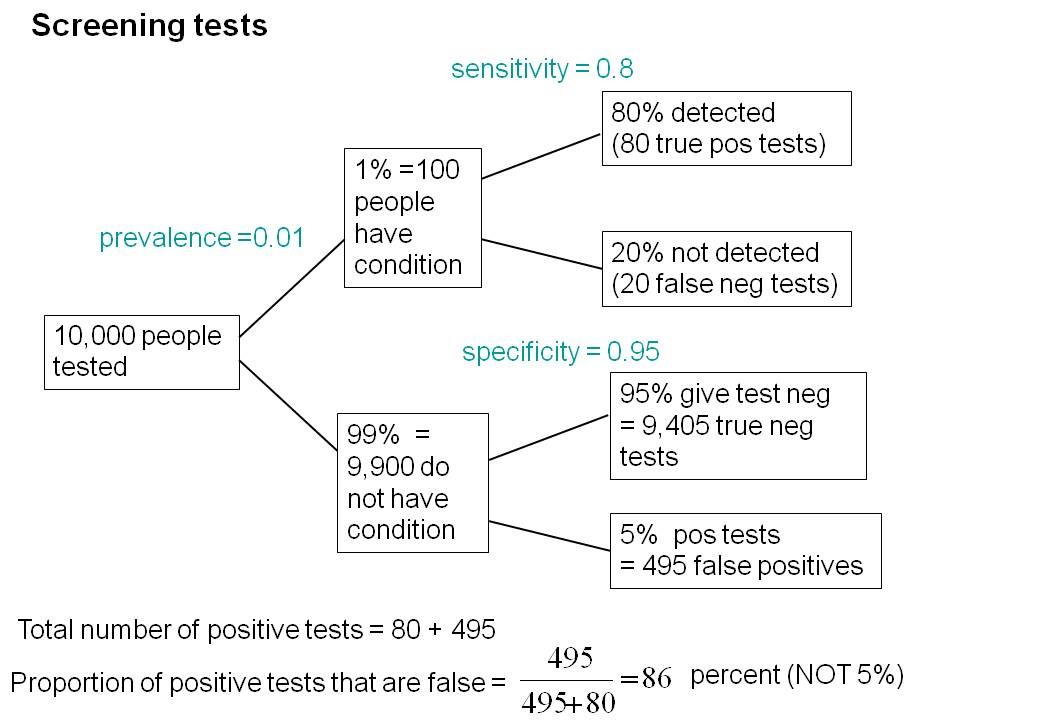
The total number of positive tests is 80 + 495 = 575, of which 495 are false positives. The fraction of tests that are false positives is 495/575= 86%.
Thus there is a 14% chance that if you test positive, you actually have MCI. 86% of people will be alarmed unnecessarily.
Even for people over 60. among whom 5% of the population have MC!, the test is gives the wrong result (54%) more often than it gives the right result (46%).
The test is clearly worse than useless. That was not made clear by the authors, or by the journal. It was not even made clear by NHS Choices.
It should have been.
It’s easy to put the tree diagram in the form of an equation. Denote sensitivity as sens, specificity as spec and prevalence as prev.
The probability that a positive test means that you actually have the condition is given by
\[\frac{sens.prev}{sens.prev + \left(1-spec\right)\left(1-prev\right) }\; \]
In the example above, sens = 0.8, spec = 0.95 and prev = 0.01, so the fraction of positive tests that give the right result is
\[\frac{0.8 \times 0.01}{0.8 \times 0.01 + \left(1 – 0.95 \right)\left(1 – 0.01\right) }\; = 0.139 \]
So 13.9% of positive tests are right, and 86% are wrong, as found in the tree diagram.
The lipid test for Alzheimers’
Another Alzheimers’ test has been in the headlines very recently. It performs even worse than the 15-minute test, but nobody seems to have noticed. It was published in Nature Medicine, by Mapstone et al. (2014). According to the paper, the sensitivity is 90% and the specificity is 90%, so, by constructing a tree, or by using the equation, the probability that you are ill, given that you test positive is a mere 8% (for a prevalence of 1%). And even for over-60s (prevalence 5%), the value is only 32%, so two-thirds of positive tests are still wrong. Again this was not pointed out by the authors. Nor was it mentioned by Nature Medicine in its commentary on the paper. And once again, NHS Choices missed the point.
Why does there seem to be a conspiracy of silence about the deficiencies of screening tests? It has been explained very clearly by people like Margaret McCartney who understand the problems very well. Is it that people are incapable of doing the calculations? Surely not. Is it that it’s better for funding to pretend you’ve invented a good test, when you haven’t? Do journals know that anything to do with Alzheimers’ will get into the headlines, and don’t want to pour cold water on a good story?
Whatever the explanation, it’s bad science that can harm people.
Follow-up
March 12 2014. This post was quickly picked up by the ampp3d blog, run by the Daily Mirror. Conrad Quilty-Harper showed some nice animations under the heading How a “90% accurate” Alzheimer’s test can be wrong 92% of the time.
March 12 2014.
As so often, the journal promoted the paper in a way that wasn’t totally accurate. Hype is more important than accuracy, I guess.
June 12 2014.
The empirical evidence shows that “general health checks” (a euphemism for mass screening of the healthy) simply don’t help. See review by Gøtzsche, Jørgensen & Krogsbøll (2014) in BMJ. They conclude
“Doctors should not offer general health checks to their patients,and governments should abstain from introducing health check programmes, as the Danish minister of health did when she learnt about the results of the Cochrane review and the Inter99 trial. Current programmes, like the one in the United Kingdom,should be abandoned.”
8 July 2014
Yet another over-hyped screening test for Alzheimer’s in the media. And once again. the hype originated in the press release, from Kings College London this time. The press release says
"They identified a combination of 10 proteins capable of predicting whether individuals with MCI would develop Alzheimer’s disease within a year, with an accuracy of 87 percent"
The term “accuracy” is not defined in the press release. And it isn’t defined in the original paper either. I’ve written to senior author, Simon Lovestone to try to find out what it means. The original paper says
"Sixteen proteins correlated with disease severity and cognitive decline. Strongest associations were in the MCI group with a panel of 10 proteins predicting progression to AD (accuracy 87%, sensitivity 85% and specificity 88%)."
A simple calculation, as shown above, tells us that with sensitivity 85% and specificity 88%. the fraction of people who have a positive test who are diagnosed correctly is 44%. So 56% of positive results are false alarms. These numbers assume that the prevalence of the condition in the population being tested is 10%, a higher value than assumed in other studies. If the prevalence were only 5% the results would be still worse: 73% of positive tests would be wrong. Either way, that’s not good enough to be useful as a diagnostic method.
In one of the other recent cases of Alzheimer’s tests, six months ago, NHS Choices fell into the same trap. They changed it a bit after I pointed out the problem in the comments. They seem to have learned their lesson because their post on this study was titled “Blood test for Alzheimer’s ‘no better than coin toss’ “. That’s based on the 56% of false alarms mention above.
The reports on BBC News and other media totally missed the point. But, as so often, their misleading reports were based on a misleading press release. That means that the university, and ultimately the authors, are to blame.
I do hope that the hype has no connection with the fact that Conflicts if Interest section of the paper says
"SL has patents filed jointly with Proteome Sciences plc related to these findings"
What it doesn’t mention is that, according to Google patents, Kings College London is also a patent holder, and so has a vested interest in promoting the product.
Is it really too much to expect that hard-pressed journalists might do a simple calculation, or phone someone who can do it for them? Until that happens, misleading reports will persist.
9 July 2014
It was disappointing to see that the usually excellent Sarah Boseley in the Guardian didn’t spot the problem either. And still more worrying that she quotes Dr James Pickett, head of research at the Alzheimer’s Society, as saying
These 10 proteins can predict conversion to dementia with less than 90% accuracy, meaning one in 10 people would get an incorrect result.
That number is quite wrong. It isn’t 1 in 10, it’s rather more than 1 in 2.
A resolution
After corresponding with the author, I now see what is going on more clearly.
The word "accuracy" was not defined in the paper, but was used in the press release and widely cited in the media. What it means is the ratio of the total number of true results (true positives + true negatives) to the total number of all results. This doesn’t seem to me to be useful number to give at all, because it conflates false negatives and false positives into a single number. If a condition is rare, the number of true negatives will be large (as shown above), but this does not make it a good test. What matters most to patients is not accuracy, defined in this way, but the false discovery rate.
The author makes it clear that the results are not intended to be a screening test for Alzheimer’s. It’s obvious from what’s been said that it would be a lousy test. Rather, the paper was intended to identify patients who would eventually (well, within only 18 months) get dementia. The denominator (always the key to statistical problems) in this case is the highly atypical patients that who come to memory clinics in trials centres (the potential trials population). The prevalence in this very restricted population may indeed be higher that the 10 percent that I used above.
Reading between the lines of the press release, you might have been able to infer some of thus (though not the meaning of “accuracy”). The fact that the media almost universally wrote up the story as a “breakthrough” in Alzeimer’s detection, is a consequence of the press release and of not reading the original paper.
I wonder whether it is proper for press releases to be issued at all for papers like this, which address a narrow technical question (selection of patients for trials). That us not a topic of great public interest. It’s asking for misinterpretation and that’s what it got.
I don’t suppose that it escaped the attention of the PR people at Kings that anything that refers to dementia is front page news, whether it’s of public interest or not. When we had an article in Nature in 2008, I remember long discussions about a press release with the arts graduate who wrote it (not at our request). In the end we decides that the topic was not of sufficient public interest to merit a press release and insisted that none was issued. Perhaps that’s what should have happened in this case too.
This discussion has certainly illustrated the value of post-publication peer review. See, especially, the perceptive comments, below, from Humphrey Rang and from Dr Aston and from Dr Kline.
14 July 2014. Sense about Science asked me to write a guest blog to explain more fully the meaning of "accuracy", as used in the paper and press release. It’s appeared on their site and will be reposted on this blog soon.

Disappointing that NHS Choices missed the point both times. They are usually one of the few places you can get sense about what lies behind the dismal media stories and the underlying PR up-spin.
I was out doing a ‘Univ of the 3rd Age’ talk on pseudoscience recently, and it was clear a lot of the people there were baffled by what to make to the stories about (e.g.) statins and risk. Next time I do one of these talks I think I might include your ‘Alzheimer’s Test’ examples.
Given how crap the tests are, not to mention the fact that there are no effective therapies if you ARE diagnosed with Alzheimer’s, one wonders why the laughable Jeremy Hunt is bigging up ‘early diagnosis’. I guess if the Saatchi Bill passes then the geriatricians will soon be dishing out Cholinesterase Inhibitors like Smarties, all paid for on ‘personal health accounts’, or something. Should make the PharmaCos happy. Do you suppose they are Tory donors?
Dr Aust said:
“Should make the PharmaCos happy. Do you suppose they are Tory donors?”
Wot? Surely not…
But this is an excellent example that clearly explains sensitivity and specificity.
I’d like to see more emphasis on analysis that would indicate the true status of such tests. These tests would probably not be of medical benefit for widespread screening at present; but that is not because they are ineffective or bad science. It’s because there is currently relatively little medical benefit to knowing you are at high risk of Alzheimers (AD). Considering how much (Shannon) information is required to identify who in the population will develop AD, either test actually provides about 1/3 of that information (40% in the over 60s). This is a rather abstruse, albeit fundamental statistic. More constructive is to look at how much benefit there would have to be (relative to the cost of giving someone a false positive indication) from an early correct indication. With the first test this would have to be about 6:1 in the wider population and about 1.2:1 in the over 60s (11:1 and 2.1:1 for the second test), according to my calculations*. At present these costs and benefits (always somewhat imponderable) maybe centre around motivational attitudes and planning for care, finance and accommodation more than medical issues, but I’m not sure the screening tests are that bad, looked at this way.
*(1-p)(1-s)/(pv) where p=prevalence, s=specificity, v=sensitivity.
I covered similar ground in my recent article – now available at PharmaFile:
http://www.pharmafile.com/news/182580/look-beyond-screen
@Majikthyse
I did start by saying there was nothing new. It’s all been said dozens of times before, going back many decades,especially in the statistical literature. Margaret McCartney’s book, The Patient Paradox, is a good recent example.
My reason for saying it, yet again, is that it has been consistently ignored by authors, by journal editors and by journalists. It is about time they learned to listen.
I had another motive too. It provides a good introduction to the problems of interpretation of tests of significance. That will be coming later.
@Tony Gardner-Medwin
My point was not that the tests are bad science, but that they are quite remarkably ineffective. Any test that gives the wrong answer in the majority times it’s used, can’t be described as effective. That is just a statistical problem. If a condition is rare in the population under test, you are bound to get a large number of false positives from the large number of people who don’t have the condition. No argument based on Shannon information can do anything about that. All you need is some conditional probabilities.
Even if one had a perfect test, I don’t see much point in screening people for things like AD, because there is no treatment that works. It’s a bit more complicated in, say, breast cancer, because something can be done about that, and the sooner it’s done the better. In cases like that, you have to balance the (relatively small) number of people whose lives are saved against the larger number of people who have unnecessary mastectomies. That’s a difficult decision.
While I totally agree with your point about the limited value and poor analysis of screening tests, I take issue with the idea there’s nothing you can do if you are at high risk for dementia. It’s true there’s nothing medical you can do, but there are life choices you can make to maximize your resilience and that of your loved ones if it happens. You can express your wishes about end of life care, for example, or make different financial planning choices, move into home that is accessible to the handicapped, talk to your kids – it can stop the dementia but can help reduce its impact.
My apologies for not spotting this interesting discussion sooner! The root of the problem is that screening test results should be regarded as ‘symptoms’. The absence of a symptom e.g. a cough makes a disease (e.g. TB) even less likely but the presence of a symptom merely suggests a list of possible causes of which TB is but one. Those who think that a positive screening test ‘suggests’ any single diagnosis fail to understand the purpose of screening and the nature of the diagnostic process. Like symptoms, positive screening tests suggest a differential diagnosis, one of which is a benign or self limiting finding that often resolves before we complete our investigations. A patient with a symptoms or positive screening test needs a sensible doctor to guide them through this worrying time. Bayes theorem with sensitivity and specificity models the screening process but in order to understand differential diagnosis one must use the reasoning by probabilistic elimination, which is described in the Oxford Handbook of Clinical Diagnosis; it will be described in even more detail in the forthcoming 3rd edition out later this year.
@Huw
That all sounds very reasonable. But the proposal is to screen healthy patients. That means that there are no symptoms or signs for a doctor, however “sensible”, to work on, if the test should come out positive.
If the doctor were to reveal the positive result to the patient, as they presumably would, what would they say? You may have MCI (which many sometimes develop into dementia) but there’s a 90% chance that you’re fine. And even if you have it much later, there aren’t any effective drugs to help.
If my doctor were to tell me that. I would not be at all impressed.
I was making a general point about screening and for this reason used TB as an example. In the case of AD (which is only one ‘cause’ of many ‘causing’ cognitive impairment), early diagnosis is ensuring that someone showing suspicious symptoms should be assessed discreetly and tactfully and if they lack some important capabilities of daily living, offered help without delay. We do this all the time in hospital medical admission units by using similar tests to Scharre et al’s SAGE. This is also how the SAGE test could also be used if validated sensibly. The ‘sensitivity of 79% and specificity of 95% described in Scharre et al’s paper was based on another study with 21 ‘normal’ patients and 42 with dementia or MCI (see their reference 26). Its use therefore in predicting future AD so that it can be prevented is no more than mischievous publicity-seeking speculation.
Screening for a future disease that cannot be confirmed and which thus cannot be used to make useful predictions or cannot be treated is indeed ‘quackery’. However, ‘quackery’ is often the result of ignorance or misunderstanding. I think that a major culprit is the idea of ‘specificity’, which does not mean what it implies on the tin. The ‘specificity’ changes dramatically depending on the population tested even if the test result predicts the diagnosis with the same probability in different populations. For example, the greater the number of healthy individuals (or those with irrelevant unrelated diseases) with a ‘negative’ result in the population, the higher will be the specificity.
When a test is advocated for screening, its advocates should state the prevalence of the condition in the population to be tested (e.g. in those lying on trolleys in A&E, in those sitting in a GP waiting room or in those walking briskly along the street). They should then give for that population, estimates of the proportion with the condition given each numerical value of the test (in the form of a histogram or a probability function). If they add a cut-off point to create ‘positive’ or ‘negative’ ranges, they should state the proportion with the condition in these ranges. In the jargon, these proportions are called ‘the predictiveness’. In screening, all else is smoke and mirrors.
You say
That’s pretty much what I was saying too.
Sensitivity, specificity and likelihood ratios cannot be assumed to be the same in different populations. They have to be observed afresh each time. As all the indices are measureable, including the predictiveness, they should all be documented. In large populations where the diagnosis tends to be rare, the specificities approach 1 but there can be a big difference in the predicitveness between a specificity of 99.0% and 99.9%. In the example where the sensitivity is 90% the specificity is 99% and the prevalence 1%, the predictiveness is 0.476. However, if the specificity is 99.9%, then the predictiveness is 0.9.
It is widely assumed that a specificity and sensitivity is the same in different medical populations, which is why Scharre et al’s indices of a specificity of 95% and sensitivity of 79% were applied to the general population. However, these indices were based on 21 patients with dementia, 21 patients with MCI and 21 ‘normal’ people in a highly selected population. This assumption of equal specificities and sensitivities would only apply if one population was a large random sample from the other, which was not the case in the Scharre et al example. Such random selection is rare in medical practice because patients are usually selected for transfer from one population to another.
For example, If 200 patients had severe abdominal pain in a community of 100,000 and 100 patients had appendicitis of which 75 had severe abdominal pain, then the predicitivenss is 75/200 = 0.375. The likelihood ratio is 75/100 divided by 125/99,900 = 599.4 (the specificity being 99875/99900 = 0.9997). The post-test probability of appendicitis given severe abdominal pain would be 1/{1+[99,900/100 x 1/599.4]} = 75/200=0.375. If all these patients with severe abdominal pain and appendicitis were admitted to the community’s hospital as part of a total of 1000 admissions in a defined period, then the pre-test probability of appendicitis in the hospital would be 100/1000. If it is assumed that the sensitivity, specificity and likelihood ratio is similar in both populations then the post-test probability of appendicitis given severe abdominal pain in hospital is 1/{1+[900/100 x 1/599.4]} = 0.985. However, because all 200 patients with RLQ pain and all 100 with appendicitis in the community were admitted, the actual probability of appendicitis for those with severe abdominal pain in the hospital is 75/200 = 0.375 – the same as in the community. So the calculated post-test probability of appendicitis given RLQ pain of 0.985 is a gross overestimate. In this case, the sensitivity regarding severe abdominal pain in hospital remains the same at 0.75, but the specificity has been changed in the hospital population by the referral action of doctors in the community and is now 0.86111.
A screening test result or the initial presenting symptom alone is rarely adequate to confirm a diagnosis in order to plan treatment. The diagnostic process involves combining other symptoms, signs and test results during probabilistic reasoning by elimination often followed by non-probabilistic ‘logical’ application of diagnostic criteria followed by value judgements (that can be modelled by Decision Analysis). Bayes theorem, specificities, likelihood ratio etc are not helpful in these stages and another theorem has to be applied which uses ratios of ‘sensitivities’ or ratios of ‘predictivenesses’ (ugh!). This is explained in the Oxford Handbook of Clinical Diagnosis and will be covered in greater detail in the 3rd edition due out this summer.
As a tolerably healthy 69-year old I would certainly value a test if it identified that I had either a 46% or a 1% chance of developing progressive dementia in the next few years, given a background prevalence of 5%. I would do some things differently, depending on the result, even recognising that doctors probably couldn’t influence the outcome much if at all. Having looked at a SAGE test printout ( http://sagetest.osu.edu ), I have to say I am somewhat reassured – though I don’t really believe that the quoted sensitivity and specificity estimates (based on a rather small and perhaps not very clearly characterised set of people) mean that the test has anything like the caricature properties I describe. The quoted paper shows that the test is practicable at negligible cost and, as they say, could help “start the conversation” about cognitive impairment with a GP. I honestly don’t see the problem. If anyone might misunderstand the test result as a definitive diagnosis and sure predictor of the future, then it is the role of the GP to dispel such ideas. As Huw says, a test result like this is like a symptom, with several possible explanations but worthy of keeping an eye on.
@Tony Gardner-Medwin
You say
I guess that is a matter of taste. I would not wish to take a test as inaccurate as that. There is no harm in having it available for those who do wish to take it as long as it’s accompanied by a clear statement that if the test says you are ill there’s a 50:50 chance that you aren’t ill. As far as I know, tests aren’t accompanied by any such warning.
@Huw
Yes of course you are right to say that if you use a wrong value of specificity you’ll get the wrong answer. My point was that in cases where prevalence is low, the specificity has to be very high indeed (probably unattainably high) to avoid a high false discovery rate.
Your example is interesting, but you are talking about people who are already ill. I was talking about the mass screening of healthy people. That’s where the biggest problems lie.
I suspect that a high proportion of patients (and probably most patients in primary care) with symptoms are also healthy; they simply have self-limiting sensations that take them to doctors. It is a form of self-propelled screening. The set and probability theory for such screening with symptoms is the same as for tests. The familiar and accepted measuring of blood pressure is also screening of course. Furthermore, many of those with distressing symptoms whom we actually treat would have done just as well without treatment because of the body’s homeostatic and self-repair mechanisms. In other words, the number needed to treat for one to benefit is probably surprisingly high in modern medicine. One aim of research is to improve our predictions in order to target treatment more effectively so that the number needed to treat for one to benefit becomes lower. This is the aim of so-called ‘stratified medicine’. We have been doing this all along of course (e.g. by stratifying dropsy into nephrotic syndrome, heart failure, etc). It is my contention that most scientific effort is wasted because the logic, set and probability of clinical reasoning is so poorly understood. I am trying to remedy this in the Oxford Handbook of Clinical Diagnosis.
@Huw
Indeed it is. That’s something I go on about a lot. Statins terrible, analgesics poor, and “cough medicines” and “tonics” that don’t work at all. Regression to the mean is not just a problem for quacks.
I like the parallel Huw draws between screening tests and symptoms, both of which can lead a person to their GP. They are pointers and probability filters. Maybe we are talking to a David Colquhoun who would decline blood pressure measurement as well as cognitive impairment testing, and who doesn’t listen to the weather forecast when planning his weekend. I doubt it! These tests are not ‘inaccurate’ because they don’t tell you exactly what’s going to happen. They (like painful elbows or a need to get out of the house) are reasons to think about causes, consequences and options.
Actually, if you try the SAGE test, you will see that a poor score on it can’t even be classed as a clinical ‘sign’ like high blood pressure (something informative, but not evident to the patient). Consistently poor scores would reveal a degree of impairment that is almost certainly already evident to the subject – in other words a symptom. The subject may be in some sort of denial about this, but whatever the cause (stress, drugs, visual or linguistic issues, infarcts, dementia, etc.) it is something they should confront constructively with doctors and family. A ‘false positive’ is not someone who actually doesn’t have a problem, but someone whose problem doesn’t match whatever they are being correlated with. It is of course quite wrong to bill such a failed test as a diagnosis or definite predictor of Alzheimers. No scientist or medic is doing this. But it is scary if people who would fail this test are not facing up to their problem: possibly even endangering others in cognitively challenging situations like driving. There is a lot more to this than just whether there is an effective medical treatment available for the worst possible condition (maybe AD) that may be causing poor test performance.
@Tony Gardner-Medwin
Actually, in the example I give, 98% of those who test negative get the correct diagnosis (since 99% really are negative, that’s not surprising). But if only 14% of those who test positive are actually ill, and they are not warned that they have an 86% of being fine, that’s an awful lot of people who will be terrified unnecessarily. That seems rather cruel to me.
This discussion keeps raising important issues. A common cause of cognitive impairment is ‘vascular dementia’ due to ‘mini-strokes’ suggested by ‘scarring’ on a CT scan in someone with cognitive impairment (suggested by symptoms e.g. being unable to find the way home or a poor score when taking some questionnaire test). Unlike AD, its risk or progression can be reduced by anti-platelet therapy (e.g. aspirin) and statins. This is an example of how ‘stratifying’ a diagnosis (e.g. ‘dementia’ into AD, vascular dementia, etc) advances knowledge. The NNT from such treatment for one patient to benefit will vary.
A high NNT is now being called ‘over-treatment’ due to ‘over-diagnosis’. The finger of blame is pointed at pharmaceutical companies trying to maximise sales and their corrupting influence on scientists and doctors. However, I think that much of the blame is ignorance e.g. by imposing over-simplifying cut-off points resulting in large numbers of patients being given an unnecessary diagnosis and adverse effects through over-treatment. I get blank looks and apparent incomprehension when I try to explain this to representatives from NICE, statisticians, evidence-based medicine advocates and journal editors who have been advocating these methods for decades and perhaps are reluctant to admit they were wrong all along.
For example, I have shown that when screening diabetics for micro-albuminuria, the number needed to treat (NNT) for one patient to benefit when the albumin excretion rate (AER) is 19 (below 20, normal and not treated) is obviously similar to when it is 21 (above 20, abnormal and treated). The NNT is about 200 to prevent one getting nephropathy (an AER of greater 200mcg/min) within 2 years! The risk of nephropathy is about 1/200 until the AER is above 40 when the risk begins to rise. At present about 1/3 of the patients diagnosed with ‘micro-albuminuria’ and being treated have an AER between 20 and 40mcg/min. See: Llewelyn DEH, Garcia-Puig J. How different urinary albumin excretion rates can predict progression to nephropathy and the effect of treatment in hypertensive diabetics. J Renin Angiotensin Aldosterone System. 2004; 5:141– and http://www.bmj.com/content/344/bmj.e1238?sso=.
*Nice write up, I’m not going to weigh in on the merits of screening / not-screening as I would be wandering far outside my domain very quickly. Taking the converse of your equation – would the odds of being negative based on a negative result be : (1-prev)(spec) / ((1-prev)(spec)+(1-sens)(prev)) ? ( 99.79% with your example numbers above )
I’d like to try and come up with a visualization to teach this and wanted to make sure I had the math right before I dove in. The math itself isn’t hard, in and of itself, but there does seem to be a cognitive bias towards interpreting large percentages as “good” ( 98% sounds really quite positive, doesn’t it? )
@SLewis
Yes, your calculation is quite right. The easiest way to see it is directly from the tree diagram. There are 9,405 true negative tests and 20 false negative tests. Therefore, out of the total of 9425 negative tests, 9405 are correct, so 9405/9425 = 99.79% are correct.
That’s good, but bear in mind that if picked a person at random and declared them to be negative without doing a test at all, you’d be right 99% of the time (because, in this example, only 1% of the population are positive). Looked at this way, 99.79% is rather less impressive.
[…] This post is about why screening healthy people is generally a bad idea. It is the first in a series of posts on the hazards of statistics. […]
[…] We can help to create time by challenging the dogma that more screening is better and, for example, stop screening for dementia and breast cancer and general health checks that dont help the majority of patients. […]
[…] gjort det länge. Jag har nått viss upplysning genom att läsa DC’s improbable science, här och framför allt […]
[…] We can help to create time by challenging the dogma that more screening is better and, for example, stop screening for dementia and breast cancer and general health checks thatdont help the majority of patients. […]
The maths and ideas you’ve presented here are so simple, why is it that so many people, myself included, miss things like this? I am ‘fairly’ proficient with stats and have a ‘decent’ scientific understanding. I am asked to research and implement stats for my lab team. When using stats for particular problems I feel like I can do the required research and find the most appropriate and justifiable stats for the problem at hand. But with things such as this I find myself simply accepting the authors’ stats as being sufficiently representative of the data when, often, it clearly isn’t. Maybe it’s because I put a lot of effort into it myself, I’m not sure.
I have to ask, how is it that you are able to spot such problems with stats in papers? Is it that you spend more time doing the maths yourself? Is it that you are just used to seeing these types of data? Is it that you have a deeper understanding of how the data should have been represented? Do you just have a lots of stats experience?…..Basically, what do you think it is that the public, researchers and journal editors are missing when looking at these papers?
I have a really keen interest in pseudoscience, misrepresentation of science, bad science etc, but still feel that I don’t have the eye for it!
Apologies for the length of this question!
Would love your thoughts on this!
@Ki_fi
Thanks for the kind remarks. The screening problem described in this post has been discussed widely for decades, so there is nothing original about this post. The application of similar ideas to tests of significance, in the second part of this post, is a bit more subtle and mildly controversial.
I guess that I’ve been interested in questions of inference since I was an undergraduate (some history here), and when I got my first academic job, I spent a lot of time writing a textbook (Lectures on Biostatistics -see left sidebar). A major theme of the book was randomisation tests. I have no idea why people still do t tests. However I missed the approach that’s outlined in this post and the next one. My day job, in analysis of single ion channels, involved a lot of statistics too, though a quite different type.
I fear that the false discovery rate problem has been ignored so widely because, if you take it seriously, it makes it much harder to claim that you’ve made a discovery. Pressure to publish has caused huge corruption of science, I fear. If you want promotion it pays to ignore it. To some extent, the blame must be taken by professional statisticians, who rarely teach it in elementary courses for biologists. The sad fact is that many biologists are almost totally innumerate. And the pressure that’s put on young scientists to publish gives them no time to remedy that. I used to give a couple of lectures about non-linear curve fitting to our final year students, but that is now deemed to be too difficult for them. It shouldn’t really be necessary for members of your group to rely on you to do statistics for them, but it doesn’t surprise me.
The journal editors and reviewers are often as innumerate as the authors so the problem is perpetuated (see this example) . Good luck in developing an eye for false claims. There is plenty of material for practice.
It may not be one of the main points of the discussion here, but as I understand it the idea is that you need a predictive screening test before you can begin to find something that, given early enough, prevents the degeneration from getting serious.
Of course there are all sorts of difficulties such as getting presently healthy people worried, and setting up a clinical trial in an ethical manner. However, I don’t think there’s another approach to this and other diseases such as Parkinson’s.
Dear David
I asked you a question on twitter about what definition of prevalence you would use in this case. 140 characters is not always enough to get enough detail, so I wanted to ask you again here!
I understand that prevalence is the percentage of a population that has the condition in question. In the case of (say) ultrasound screening for AAA, it is the percentage of the population being screened that have an AAA – and it is therefore easy to understand the use of this figure to calculate the PPV of ultrasound screening using the sensitivity and specificity. I also understand that the prevalence will vary depending on which population you’re talking about – so the prevalence of AAA will be much higher in a population over 70 years old than a population under 20.
However, where a test is trying to predict whether a condition is going to develop in the future, isn’t prevalence less straight-forward?
The Guardian article you referred to today (9th July) suggests that the protein-based test for Alzheimer’s is aimed at a population of people who are already known to have mild cognitive impairment (MCI), and the article states – I have no idea if this is accurate – that 60% of people with MCI will go on to develop Alzheimer’s disease in the future. It is this population of people with MCI who the protein test is aimed at.
Therefore, at the time of taking the test, the prevalence of Alzheimer’s in this population should be zero, but at some point in the future it will be 60%.
The situation would be similar for any condition where there is a “pre-condition” that may develop (e.g. cervical screening).
So… My question is: When looking at tests that are trying to predict the development of a condition that is currently not present, how do we decide what figure to use for prevalence?
Thanks for being patient! Your blog is great – but I often fear it exposes my lack of knowledge in some areas!
Dan.
@dtaston
If I have understood it correctly, the tests are intended to predict who will develop dementia in the future. They are clearly inadequate for doing that, unless the prevalence is well over 10% (the last time this came up -the subject of the original post, above -the prevalence of MCI in the over 60s was estimated as 5% which gives a disastrous error rate of 73% in the present case).
Even if the test were satisfactory for MCI. the fact that many cases of MCI don’t develop into dementia makes the test even worse if regarded as a prediction for dementia, rather than fo MCI..
Clearly estimates of prevalence are pretty approximate, but there seems to be broad agreement of about 5 – 15% in vulnerable populations. It can be estimated by the fraction of some defined population which eventually develop dementia. There isn’t any problem, apart from the fact that you have to wait until people die before you get the answer.
Of course if 100% of the population would eventually get Alzheimer’s, then a positive test would always be right, but luckily we are far from that situation.
The press coverage of the Lovestone report not only ignores the statistics that make the test unusable for diagnostic purposes, as DC (and many others) have repeatedly stressed; it is also claimed to to be a significant breakthrough in improving clinical trials for new drugs aimed at retarding or preventing AD. The ‘breakthrough’ is that identifying pre-AD individuals (albeit not at all reliably), would allow drug trials to target these individuals, in the hope of inhibiting the pathological process at an early stage before it has caused dementia. What this ignores is the fact that the study compared subjects with mild cognitive impairment (MCI) who progressed to AD within 1 year, with MCI patients who did not develop AD in that time. Since the pathology underlying AD precedes the appearance of symptoms by 15 or so years , detecting it 1 year earlier than cognitive testing can do, is only a small step forward – a step in the right direction, but hardly a breakthrough.
@Humphrey,Rang
Thanks very much for pointing out a quite different problem. It’s good to hear from someone who has your extensive experience of drug development
@David Colquhoun
“If I have understood it correctly, the tests are intended to predict who will develop dementia in the future. They are clearly inadequate for doing that, unless the prevalence is well over 10% (the last time this came up -the subject of the original post, above -the prevalence of MCI in the over 60s was estimated as 5% which gives a disastrous error rate of 73% in the present case).”
I agree and understand. But what if you only used the Alzheimer’s test in people who you knew already had MCI? If you agree that knowing who is going to progress from MCI to Alzheimer’s is useful information, wouldn’t that make the test worthwhile?
As far as I know, MCI is a collection of symptoms rather than a condition in its own right. Therefore it should not be a problem to diagnose MCI accurately and be sure that the population you are going to use the Alzheimer’s test in all definitely have MCI.
The impression I got from the Guardian article (and I acknowledge they might have it wrong) was that they were aiming to use this test in people who were known to have MCI. This is different from the other test for Alzheimer’s that was in the news in March where they were talking about using it for anyone at all (and I agree completely that this would be utterly useless!).
Dan.
Thanks for an excellent discussion – I certainly fell victim to Tweeting about the more interesting proteins tracked by KCL’s ‘test’ before checking for the devil in the detail.
Like many here though, I’m still not entirely clear on the issues.
False discovery-rate does seem to be a problem here (http://bit.ly/1xSVzam). I’m not sure, however, that the prevalence issue is quite so severe.
The test is not intended to diagnose Alzheimer’s, and in fact has no value for that (as admitted in the primary publication). It is intended to predict MCI to Alzheimer’s conversion. The prevalence of MCI is around 15-20% for those aged over 60 (http://bit.ly/1qVUXzR). The rate of conversion to Alzheimer’s within that MCI population is, however, much higher (as much as 70%: http://1.usa.gov/1k5V30g). Given that the test would only be given to those with MCI, is the relevant prevalence statistic not therefore in the region of 70%?
Had all the multiple comparisons been done effectively I would have thought this assay, combined with genetic testing and the lipid biomarkers reported in March, might have been of some use. Certainly not a total write-off anyway. Or have I totally misunderstood?
As for the lack of an available therapy it’s worth bearing in mind that these tests are being developed against the background of large public-private partnership Alzheimer’s prevention trials (e.g. http://bit.ly/1n83qbL). If these pay dividends, we’ll need a test, and if we don’t start developing one now that test won’t be remotely ready. It’s all a gamble really…
@DrADKline
“The test is not intended to diagnose Alzheimer’s, and in fact has no value for that (as admitted in the primary publication). It is intended to predict MCI to Alzheimer’s conversion. The prevalence of MCI is around 15-20% for those aged over 60 (http://bit.ly/1qVUXzR). The rate of conversion to Alzheimer’s within that MCI population is, however, much higher (as much as 70%: http://1.usa.gov/1k5V30g). Given that the test would only be given to those with MCI, is the relevant prevalence statistic not therefore in the region of 70%?”
This is exactly the point I was trying to make. Your explanation is probably clearer than mine!
daston
I think our posts crossed – I hadn’t seen yours when typing mine. Your take on it seems just as clear as my own.
I think the main point is that any such test will not be used in isolation. If preceded by PET scans (I think tau ligands will be superior to the current amyloid ligands) and/or CSF amyloid/tau measurements (see IWG-2 criteria: http://bit.ly/1qbH6l9) to further narrow down the MCI test population it should be possible to get the prevalence level of conversion to #Alzheimer’s to above 90%.
We should have a good idea within the next 5 years whether any of the current potential preventative therapies have any effect. Assuming a reasonably low side-effect profile I’d be happy to take such a drug for a year-or-so if there was ANY chance I may convert to Alzheimer’s.
My real concern with the KCL data is just how relevant all the protein markers in table 3 actually are given potential multiple comparisons issues. ApoE, and ApoJ (clusterin) are both genetic risk factors for Alzheimer’s. Transthyretin is linked to amyloidosis, but the others?
David,
Back when I was a young and overenthusiastic schoolboy I read a book titled ‘Reckoning with Risk‘ by Gerd Gigerenzer. In it he argued that the human brain is by nature thoroughly inept at rationalising statistics when presented as probabilities or, perhaps slightly better but not much, percentages. Instead he suggested that authors should present natural frequencies to convey statistics if they want their readers to understand their meaning. This is of course if an author truly wants the reader to understand their meaning.
With this in mind, I was pleased that you used frequencies (as well as probabilities and percentages) to illustrate the screening problem in this blog.
It strikes me that Gigerenzer’s point is as valid now as it was then. Most papers, and importantly press releases, quote statistics in probabilities or percentages rather than in frequencies. Maybe this contributes to some of the wider misunderstanding that follows.
To prove his point, in his book Gigerenzer cited some of his own research where clinicians were asked to calculate the chance of disease given a positive screening test. The clinicians almost universally failed to get the correct answer if given the data for the prevalence, specificity and sensitivity as probabilities. They did much better when the data were presented as natural frequencies, but worryingly still half the professionals got the wrong answer.
So surprised was I at this result, I decided to repeat the experiment myself on my chemistry class at school. I split the class into two groups, and gave half data for the mammography screening problem as probabilities, and the other half the data as frequencies. They were then asked them to calculate the chance of actually having breast cancer given a positive mammogram test. It wasn’t a randomized trial however, as I made sure to give our chemistry teacher the version with the probabilities.
If I remember correctly the results were very much in line with Gigerenzer’s, if perhaps my classmates did slightly better across both groups than the German physicians. In the probabilities group, my teacher failed to get the correct answer in line with what I had expected by the laws of probability.
Finally I note that the Cochrane collaboration has recently researched the effects of presenting health statistics in different forms. They concluded that members of the public understand the statistics better when presented as natural frequencies. The flip-side is that this may make them less likely to accept a treatment when they realise how marginal the benefit may be.
@Alex Malins
I agree with everything you say. There was a good example on the morning radio news programme within the last half hour. A study claimed that vasectomy was associated with a 20 percent increase in prostate cancer. This time, the interviewer did a good job by asking for the absolute risks. They increased from 16 per thousand to 19 per 1000. That’s much more informative than saying 20% increase, for most people.
@David
Even with my underhanded trickery to my chemistry teacher?
It would be interesting to see the robustness of the statistics in the study that claims vasectomy is associated with a 20 percent increase in prostate cancer. Especially given the disease is so rare and the proposed effect is so small.
I also meant to add that Reckoning with Risk is well worth a read, if a bit repetitive towards the end. It covers problems with statistics used not only in medicine, but in the courts and criminal investigations as well.
*How do these calculations change if the test is repeated?
In employment drug screening, for example, usual practice would seem to be to take two samples and test the second if there is a positive result. The reasoning being that this renders the test much more “accurate” – i.e. increases the positive predictive value.
If the test fails, how great is the contribution of specific factors in the donor under test and how much is independent random variation? Does running the test twice gain anything?
[…] We can help to create time by challenging the dogma that more screening is better and, for example, stop screening for dementia and breast cancer and general health checks thatdont help the majority of patients. […]
[…] like that, it’s just old age’. They were equally disturbed by the thought of unsolicited dementia screening and thought that older people had been afraid that their GP might use any opportunity to diagnose […]