
Download Lectures on Biostatistics (1971). Corrected and searchable version of Google books edition
Download review of Lectures on Biostatistics (THES, 1973).
The two posts on this blog about the hazards of s=ignificance testing have proved quite popular. See Part 1: the screening problem, and Part 2: Part 2: the false discovery rate. They’ve had over 20,000 hits already (though I still have to find a journal that will print the paper based on them).
Yet another Alzheiner’s screening story hit the headlines recently and the facts got sorted out in the follow up section of the screening post. If you haven’t read that already, it might be helpful to do so before going on to this post.
This post has already appeared on the Sense about Science web site. They asked me to explain exactly what was meant by the claim that the screening test had an "accuracy of 87%". That was mentioned in all the media reports, no doubt because it was the only specification of the quality of the test in the press release. Here is my attempt to explain what it means.
The "accuracy" of screening tests
Anything about Alzheimer’s disease is front line news in the media. No doubt that had not escaped the notice of Kings College London when they issued a press release about a recent study of a test for development of dementia based on blood tests. It was widely hailed in the media as a breakthrough in dementia research. For example, the BBC report is far from accurate). The main reason for the inaccurate reports is, as so often, the press release. It said
"They identified a combination of 10 proteins capable of predicting whether individuals with MCI would develop Alzheimer’s disease within a year, with an accuracy of 87 percent"
The original paper says
"Sixteen proteins correlated with disease severity and cognitive decline. Strongest associations were in the MCI group with a panel of 10 proteins predicting progression to AD (accuracy 87%, sensitivity 85% and specificity 88%)."
What matters to the patient is the probability that, if they come out positive when tested, they will actually get dementia. The Guardian quoted Dr James Pickett, head of research at the Alzheimer’s Society, as saying
"These 10 proteins can predict conversion to dementia with less than 90% accuracy, meaning one in 10 people would get an incorrect result."
That statement simply isn’t right (or, at least, it’s very misleading). The proper way to work out the relevant number has been explained in many places -I did it recently on my blog.
The easiest way to work it out is to make a tree diagram. The diagram is like that previously discussed here, but with a sensitivity of 85% and a specificity of 88%, as specified in the paper.
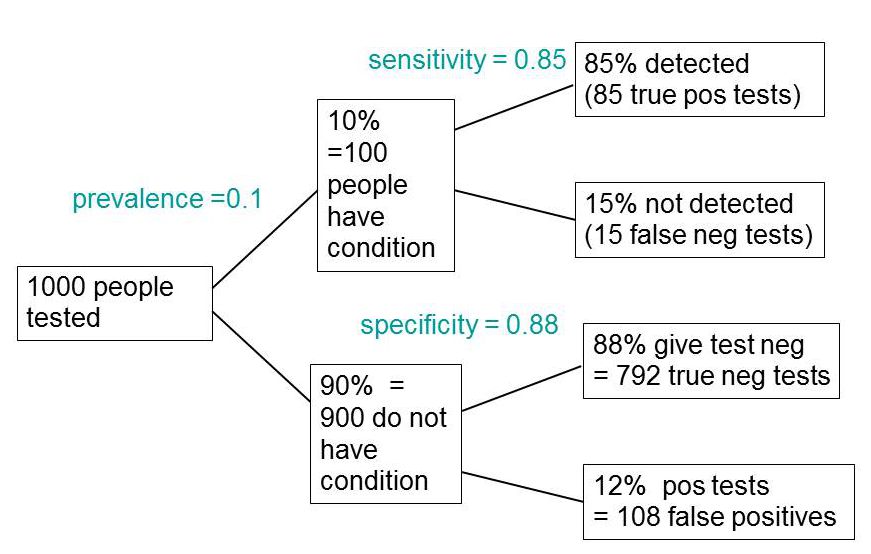
In order to work out the number we need, we have to specify the true prevalence of people who will develop dementia, in the population being tested. In the tree diagram, this has been taken as 10%. The diagram shows that, out of 1000 people tested, there are 85 + 108 = 193 with a positive test result. Out ot this 193, rather more than half (108) are false positives, so if you test positive there is a 56% chance that it’s a false alarm (108/193 = 0.56). A false discovery rate of 56% is far too high for a good test.
This figure of 56% seems to be the basis for a rather good post by NHS Choices with the title “Blood test for Alzheimer’s ‘no better than coin toss’
If the prevalence were taken as 5% (a value that’s been given for the over-60 age group) that fraction of false alarms would rise to a disastrous 73%.
How are these numbers related to the claim that the test is "87% accurate"? That claim was parroted in most of the media reports, and it is why Dr Pickett said "one in 10 people would get an incorrect result".
The paper itself didn’t define "accuracy" anywhere, and I wasn’t familiar with the term in this context (though Stephen Senn pointed out that it is mentioned briefly in the Wiikipedia entry for Sensitivity and Specificity). The senior author confirmed that "accuracy" means the total fraction of tests, positive or negative, that give the right result. We see from the tree diagram that, out of 1000 tests, there are 85 correct positive tests and 792 correct negative tests, so the accuracy (with a prevalence of 0.1) is (85 + 792)/1000 = 88%, close to the value that’s cited in the paper.
Accuracy, defined in this way, seems to me not to be a useful measure at all. It conflates positive and negative results and they need to be kept separate to understand the problem. Inspection of the tree diagram shows that it can be expressed algebraically as
accuracy = (sensitivity × prevalence) + (specificity × (1 − prevalence))
It is therefore merely a weighted mean of sensitivity and specificity (weighted by the prevalence). With the numbers in this case, it varies from 0.88 (when prevalence = 0) to 0.85 (when prevalence = 1). Thus it will inevitably give a much more flattering view of the test than the false discovery rate.
No doubt, it is too much to expect that a hard-pressed journalist would have time to figure this out, though it isn’t clear that they wouldn’t have time to contact someone who understands it. But it is clear that it should have been explained in the press release. It wasn’t.
In fact, reading the paper shows that the test was not being proposed as a screening test for dementia at all. It was proposed as a way to select patients for entry into clinical trials. The population that was being tested was very different from the general population of old people, being patients who come to memory clinics in trials centres (the potential trials population)
How best to select patients for entry into clinical trials is a matter of great interest to people who are running trials. It is of very little interest to the public. So all this confusion could have been avoided if Kings had refrained from issuing a press release at all, for a paper like this.
I guess universities think that PR is more important than accuracy.
That’s a bad mistake in an age when pretentions get quickly punctured on the web.
This post first appeared on the Sense about Science web site.

Accuracy seems to be a very useful concept! It means I can market a test that always gives negative results and in this case everyone who had the test would be happy and I could claim an accuracy of 90%!
I guess universities think that PR is more important than accuracy.”
It all depends on the desired % Accuracy.
Sorry, I’ll get my coat.
The problem is that ‘specificity’ is confusing and is a dubious index of usefulness. It would be clearer to state the probability of the dementia without knowing the test result (0.1), the probability of dementia knowing that the test was positive (it would be about 0.44) and the probability of dementia knowing that the test was negative (it would be about 0.02).
Now IF a treatment that had been shown in a clinical trial to
benefit 50% of dementia patients by preventing the condition from progressing then we can estimate the proportion who would benefit in this way if the treatment was given to everyone, given to those with a positive test result and given to those with a negative test result.
If it were given to everyone, 50% of 0.1 = 5% would benefit (NNT = 20)
If it were given to those tested positive, 50% of 0.44 = 22% would benefit (NNT = 4.5
If it were given to those tested negative, 50% of 0.02 = 1% would benefit (NNT = 100)
These figures can be used to decide on treatment in the light of possible harms etc.
All we need to know about a test’s assessment is (1) the
proportion with a positive test result that have the predicted feature (2) the proportion in the tested population who have the predicted feature (3) the proportion with a negative test result that have the predicted feature. This tells a clinical decision maker what is going on.
The other indices (sensitivity, specificity, ‘accuracy’, false
positive and negative rate, etc.) can be calculated from these three values and used to speculate using various assumptions ‘what if’ the three basic values had been different (e.g. what if the prevalence had been 0.05 instead of 0.1).
Great caution has to be exercised when doing this because it
is wrong to assume that the specificity and likelihood ratio will remain the same if the prevalence of the diagnosis changes – they both change also usually and often dramatically between clinical settings (see page 760 of the 2nd edition of the Oxford Handbook of Clinical Diagnosis and page 627 of the 3rd edition due out next week).
Thanks for those comments. You mention ” the probability of dementia knowing that the test was positive”. That’s just one minus the false discovery rate which is the most important number in my opinion. But to calculate it you have to start with values for the prevalence, specificity and sensitivity.
The
false discovery rate may be useful for some purposes. However, in day to today medical practice we
very often use the estimated probability of diagnoses conditional on a single
finding such as a symptom sign or test result.
These are termed ‘diagnostic leads’ in Oxford Handbook of Clinical
Diagnosis (OHCD), which provides hundreds of such ‘lead findings’ with their differential
diagnoses in order of probability.
The 3rd edition of the OHCD out this month describes the ‘probabilistic
elimination theorem’ and its proof, which models how findings are
interpreted during reasoning by probabilistic elimination. The diagnostician tries to
demonstrate that one or more diagnoses in a list is more probable and others
are less probable by identifying other findings that occur commonly in one or more
diagnoses so that they become more probable but rarely in others so that they become
less probable.
If a universal set (e.g. the population of patients in a
study) contains two intersecting sub-sets (e.g. a set of patients with dementia
intersecting with a set of patients with a positive test result) then there
will be 4 unconditional probabilities and 8 conditional probabilities). All 12
can be calculated provided we know at least one unconditional probability and any
two conditional probabilities. For example,
these could be the prevalence of the diagnosis, the positive predictive value
and the sensitivity.
Doctors don’t use the specificity in their reasoning and it
is fallacious to assume that it is constant in different settings when the
unconditional prior probability changes.
This assumption causes confusion and may cause severe errors if it is used
with Bayes rule to calculate a ‘new’ posterior probability of a diagnosis for
a ‘new’ prior probability.
[…] is all pretty impressive for a blood test. But is it true? Look at this tree plot diagram from a blog by Professor David […]