This is a post about Markovian queuing theory. But hang on, don’t run away. It isn’t so hard.
|
The idea came from my recent experience. On Friday 23 October, I was supposed to have a kidney removed at the Royal Marsden Hospital. At the very last minute the operation was cancelled. That is more irritating than serious. A delay of a few weeks poses no great risk for me. . |

|
The cancellation arose because there was no bed available in the High Dependency Unit (HDU), which is where nephrectomy patients go for a while after the operation. Was this a failure of the NHS? I think not and here’s why
The first reaction of a neighbour to this news was to say "that’s why I have private insurance". Well, wrong actually. For a start, at the Marsden private patients and NHS patients get identical treatment (the only difference on the NHS is that "you don’t get hot and cold running margaritas at your bedside", my surgeon said). And secondly, the provision of emergency beds poses a really difficult problem, which I’ll attempt to explain.
Bed provision raises a fascinating statistical question. How many beds must be available to make sure nobody is ever turned away? The answer, in principle, is an infinite number. In practice it is more than anyone can afford.
The HDU has eleven beds but let’s think about a simpler case to start with. If patients arrived regularly at a fixed rate, and each patient stayed for a fixed length of time. there would be no problem. Say, for example, that a patient arrived regularly at 10 am and 4 pm each day, and suppose that each patient stayed for exactly 46 hours. It’s pretty obvious that you’d need four beds. Each bed could take a patient every two days and there are two patients per day coming in. Allowing two hours for changing beds, all four beds would be occupied for essentially 100 percent of the time, actually 95% = 46 hours/48 hours).
Random arrivals
The problem arises because patients don’t arrive regularly and they don’t stay for a fixed length of time. What happens if patients arrive at random and stay for a random length of time? (We’ll get back to the meaning of ‘random’ in this context later.)
Suppose again that two patients per day arrive on average, and that each patient stays in the HDU for 46 hours on average. So the mean arrival rate, and the mean length of stay in the HDU are the same as in the first example. When there was no randomness, four beds coped perfectly.
But with random arrivals and random length of stay the situation is very different. With four beds, if a queue were allowed to build up, the average number of patients in the queue would be 21 and the average length of time a patient would spend waiting to get a bed would be 10.5 days. This would be an efficient use of resources because every time a bed was vacated it would be filled straight away from the queue. The resources would be used to the maximum possible extent:, 95%. But it would be terrible for patients. The length of the queue would, of course, fluctuate, as shown by this distribution (see below) of the queue length. Occasionally it might reach 100 or more.
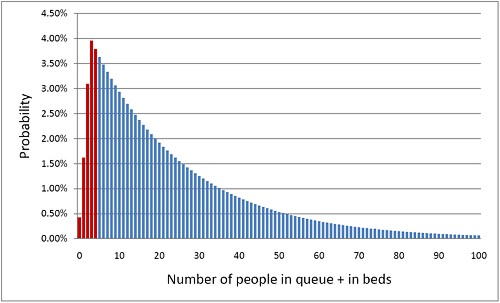
The histogram shows the total number of people in the system.The first five bins (red) represent the probabilities of 0, 1, 2, 3 or 4 beds being occupied. All the rest are in the queue.
What if you can’t queue?
For a High Dependency Unit or an Intensive Care Unit you can’t have a queue. If there is no bed, you are turned away. In the example just described, 91% of patients would have to wait, and that’s impossible in an HDU or ICU. The necessary statistical theory has been done for this case too (it is described as having zero queue capacity). Let’s look at the same case, with 4 beds, mean time between arrival of patients, 0.5 days, mean length of stay 1.917 days (46 hours).
|
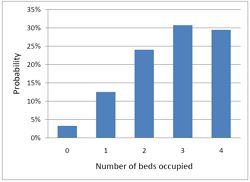
In this case there is no queue so the only possibilities are that 0, 1, 2, 3 or all 4 beds are occupied. The relative probabilities of these cases are shown on the right (they add up to 100% because there are no other possibilities). |
|
Despite the pressure on the unit, the randomness ensures that beds are by no means always occupied. All four are occupied for only 29% of the time and the average occupancy is 2.7 so the resources are used only 68% of the time (rather than 95% when a queue was allowed to form). Worse still, there is a 29% chance of the system being full, so you would be turned away.
So how many beds do you need? Clearly the more beds you have, the smaller the chance of anyone being turned away. But more beds means more cost and less efficiency. This is how it works out in our case.
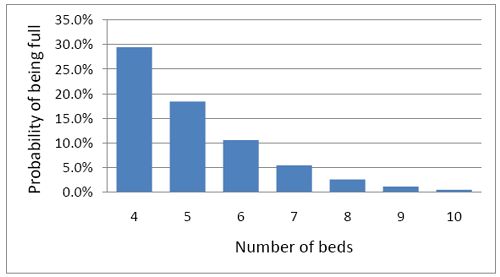
To get the chance of being turned away below 5%, rather than 29%, you’d have to double the number of beds from 4 to 8. But in doing so the beds would not be in use 68% of the time as with 4 beds, but for only 47% of the time.
|
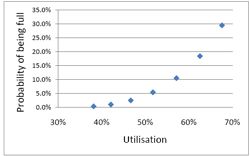
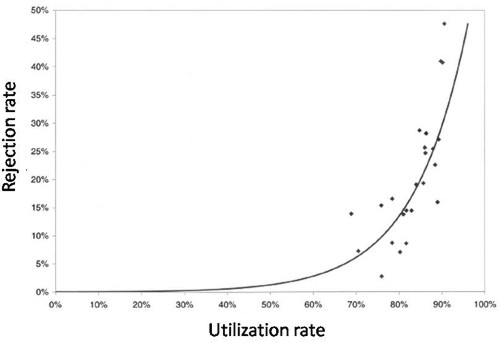
Looked at another way, if you try to increase the utilisation of beds, above 50 or 60%, then the rate at which patients get turned away goes shooting up exponentially. |
|
This isn’t inefficiency. It is an inevitable consequence of randomness in arrival times and lengths of stay.
A real life example
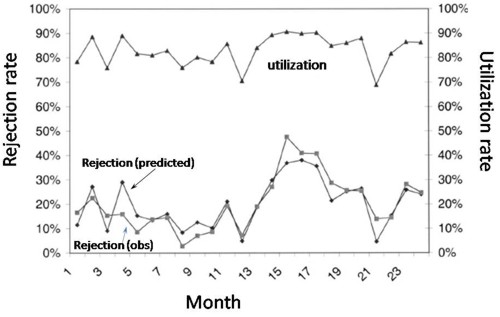
McManus et al. (2004) looked at all admissions to the medical–surgical Intensive Care Unit (ICU) of a large, urban children’s hospital in the USA during a 2-year period. (Anesthesiology 2004; 100:1271–6. Download pdf). Their Figure 2 shows the monthly average rejection rates mostly vary between 10 and 20%, so there is nothing unusual in there being no bed available in the private US medical system. For a period the rate of rejection reaches disastrous values, up to 47%. This happens, unsurprisingly, at times when the utilisation of beds was high.
The observed relationship (McManus, Fig. 3) is very much as predicted above.with a very steep (roughly exponential) rise in rejection rate when the beds are in use for more than half the time.
How to do the calculations
You can get the message without reading this section. It’s included for those who want to know a bit more about what we mean when we say that patients arrive at random rather than at fixed intervals, and that durations of stay in the unit have random rather than fixed durations.
Consider the durations of stay in the unit. They are variable in length and the usual way to represent variability is to plot a distribution of the variable quantity. The best known sort of probability distribution is the bell-shaped curve known as the Gaussian distribution. This is shown at the top of the Figure (note that pdf stands for probability density function, not portable document format).
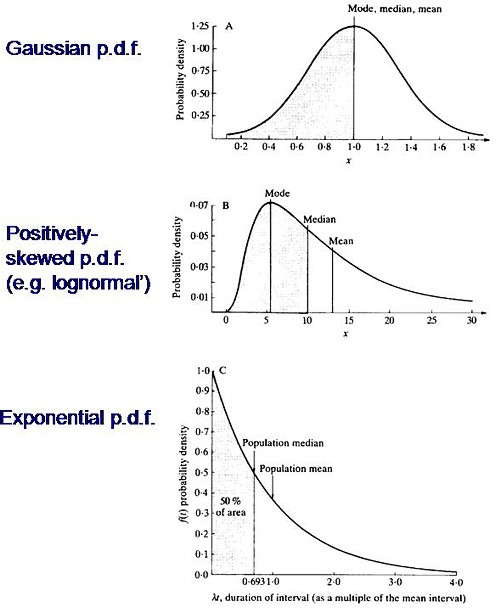
Not every sort of variability is described by a symmetrical bell-shaped curve. Quite often distributions with a positive skew are seen, like the middle example in the Figure. The distribution of incomes in the population have this sort of shape. Notice that more people earn less than average than earn more than average (the median is less than the mean). This can happen because those that earn less than average can’t get much less than average (unless we allow negative incomes), whereas bankers can earn (or at least be paid) a great deal more than average. The most frequent income (the peak of the distribution) is still smaller than the median.
An extreme form of a positively-skewed distribution is shown at the bottom. It is called the exponential distribution (because it has the shape of a decaying exponential curve). If this described personal incomes (and we are heading that way) it would mean that the most frequent income was zero and 63.2% of people earn less than average.
It is this last, rather unusual, sort of distribution that, in the simplest case, describes the lengths of random time intervals. This is getting very close to my day job. If an ion channel has a single open state, the lengths of individual ion channel openings is described by an exponential distribution.
|
The observation of an exponential distribution of durations is what would be predicted for a memoryless process, or Markov process. In the case of an ion channel, memoryless means that the probability of the channel shutting in the next microsecond is the same however long the channel has been open, This is exactly analogous to the fact that the probability of throwing a six with a die is exactly the same at each throw, regardless of how many sixes have been thrown before. |

Andrei A. Markov, 1856-1922 |
It is the simplest definition of a random length of time. For those who have done a bit of statistics, it is worth mentioning that if the number of events per unit time is described by a Poisson distribution, then the interval between events are exponentially-distributed. They are different ways of saying the same thing.
|
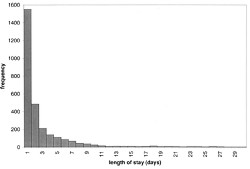
The lengths of stays in ICU in the McManus paper were roughly exponentially-distributed (right). The monthly average duration of stay ranged from 2.4 to 5.5 days, and average monthly admission rates to the 18 bed unit ranged from 4.6 to 6.2 patients per day. |
|
The monthly average percentage of patients who were turned away because there were no vacant beds varied widely, ranging from 3% up to a disastrous 47%
A technical note and an analogy with synapses
It’s intriguing to note that, in the simplest case, the time you’d spend waiting in a queue would have a simple exponential distribution (plus a discrete bit for the times when you don’t have to wait at all). The time you have to wait is the sum of all the lengths of stay of the people in front of you, and each of these lengths, in the case we discussing, is exponentially-distributed. If the queue was constant in length you can use a mathematical method known as convolution to show that the distribution of waiting time would follow a gamma distribution, a sort of distribution that goes through a peak, and eventually becomes Gaussian for long queues), However the queue is not fixed in length but its length is random (geometrically-distributed). It turns out that the distribution of the sum of a random number of exponentially distributed times is itself exponential. It is precisely this beautiful theorem that shows why the length of a burst of ion channel openings (which consists of the sum of a random number of exponentially-distributed open times, if you neglect the time spent in short shuttings) is, to a good approximation itself exponential, And that explains why the decay of synaptic currents is often close to following a simple exponential time course.
The calculations
The calculations for these graphs were done with a set of Excel add-in functions, Queueing Toolpak 4.0, which can be downloaded here. If this had been a paper of my own, rather than a blog post written in one weekend, I’d have done the algebra myself, just to be sure, The theory has much in common with that of single ion channels. Transitions between different states of the system can be described by transition rates or probabilities that don’t vary with time. The table, or matrix, of transition probabilities can be used to calculate the results, And if you want to know about the algebra of matrices, you could always apply for our summer workshop. There are some pictures from the workshop here.
Follow-up
Of course it is quite impossible for anyone who was around in the 60s to hear the name of a Russian mathematician without thinking of Tom Lehrer’s totally unjustified slur on another great Russian mathematician, Nicolai Ivanovich Lobachevsky. If you’ve never heard ‘Plagiarize’, you can hear it on Youtube. Sheer genius.
Why the size of the unit matters
This section was added as a result of a comment, below, from a statistician
At first glance one might think that if we quadruple the number of beds to 16 beds rather than 4, and we also quadruple the arrival rate to 8 rather than 2 per day, then the arrival rate per bed is the same and one might expect everything would stay the same.
As you say, it doesn’t.
If queueing was allowed, the mean queue length would be only slightly shorter, 18,7 rather than 20.9, but the mean time spent in the queue would fall from 10.5 days to 2.3 days.
In the more realistic case, with no queuing allowed, the rejection rate would fall from 29.4% to 15.5% and bed utilisation would increase from 68% to 81%. The rejection rate seems to fall roughly as the square root of the number of beds.
Clearly there is an advantage to having a big hospital with a big HDU.
Stochastic processes quite often behave unintuitive ways (unless you’ve spent years developing the right intuition).


Argh!
This brought me back to my tedious statistics years at Uni.
Strangely, one of the few things that has ‘stuck’ in my memory is Markov chains.
Thanks, Doc.
[…] This post was mentioned on Twitter by David Colquhoun and badscienceblogs, Philip Potter. Philip Potter said: Excellent article: RT @david_colquhoun Real science! Queueing for beds, Andrei Markov, and why I still love the NHS http://bit.ly/4sWHsr […]
Fascinating, but my brain hurts a little now. Too much maths for a Monday morning! Could I use this to work out how long one might have to wait for a parking space if one’s (completely hypothetical!) employer has 1,350 parking spaces but sells 2,300 permits? I could make some reasonable assumptions about length of stay, but of course people are not arriving randomly. What would I need to know about rates of arrival at different times of day?
@Mike Eslea
Uhuh, I thought I missed out the mathematics (though I just added a bit in the penultimate paragraph).
As you say, the parking problem is complicated. The arrivals would ne a non-homogenous Poisson process and work has been done on that.
The length of stay would be far from random too. Perhaps it vould be modelled with a 7.5 hour stay for administrators and a 10 hour stay for academics (with a handful of exceptions in each case)?
just to make life complicated, is availability of staff to service HDU beds also a factor affecting availability? Caught a snippet on radio 4 earlier, mentioned expected low take up of h1n1 vaccine among healthworkers & possible impact on services if there is widespread absence due to sickness.
Mike, alternatively you could just ask any of the rail companies how they model occupancy on their trains given that they routinely “oversell”.
Though of course that is less of a “how long do I have to wait for a seat” problem, and more of a “how close do I have to stand to an overflowing toilet” problem.
Forgot to say – Mrs Dr Aust says that back when she worked in sundry large urban teaching hospitals, it was widely understood by the people working on the HDUs that the “HDU bed managers” and their ilk were aiming for a minimum HDU bed occupancy rate of around 90%.
@Dr Aust
Perhaps ‘bed managers’ should read a bit more about Markov. Or simply look at the empiriacl evidence as in the McManus paper.
It’s pretty obvious that 90% bed occupancey (utilisation’) simply isn’t achievable without having a huge rejection rate.
Mrs Dr Aust opines (rather sarcastically, but in an opinion typical of doctors I have spoken to) that the average bed manager wouldn’t understand the maths, and nor (she says) would that manager’s manager.
Think the point about the empirical evidence is well made – when she and I were discussing this topic, the evidence (or not) on this was one of the things we were wondering about.
I guess it is intuitively obvious that as you shove the occupancy up you will ratchet up the wait/cancellation rate. Of course, the overall economics of this is a different question still. I presume it is complex roster-wise to only staff the beds that are occupied, given that the patient population is not predictable – and the idea of having staff working (and paid) who are only working at “half of full capacity” (i.e. managing one patient instead of two, if two is their “normal” ratio) would presumably have the HDU manager hyper-ventilating at the “waste”.
Queuing theory is great but it’s a bit abstract. I’ve done work like this using computer simulation software and it does allow for a much more direct approach to modelling processes. Packages that produce graphical representations of the process, with items moving through the process, representations of length of queues over time, are a fantastic aid to understanding.
I’ve met management consultants who’ve done this sort of thing for the NHS. If only I could remember who they were…
Ah, what do I care, I cycle to work anyway…
More than 20 years ago I was asked (as a statistician) to advise a local campaign about reorganising maternity services. The health authority was looking at occupancy data from an area with a much higher birth rate than where I was, but assuming that they could just scale everything down to half the size (or whatever the appropriate factor was) and get the same average occupancy rates and the same chance of having to turn people away. Anybody who has looked at queuing models, or indeed simulated them or whatever, knows that if you do that, it won’t work, in a system with fewer patients arriving, you will either get a lower occupancy rate or a higher chance of turning people away (or both). What shocked me at the time was that none of the NHS planners of bed occupancy gurus seemed to have heard of any of this, despite that fact that it is standard fare in planning retail operations, for instance. I’d have coped it would have got better in 20 years but it sounds as if it may not have. (In the end the health authority said that they couldn’t afford more beds so that they would just have to live with a higher chance of having to turn people away, so my efforts were all a bit wasted. And indeed, things happened much as we had predicted, only a bit worse because the birth rate was higher than projected.)
@warhelmet
I’m not sure that it’s right to describe queue theory as “abstract”. It is mathematical of course, and all stochastic problems need a bit of thought. Sometimes they can be a bit counter-intuitive. But the ‘simulation’ programs that you mention are presumably based on the mathematics, but merely conceal it from the user.
That’s fine up to a point, but personally I prefer to know what computer programs are doing with my data and that involves learning the mathematics. I suspect that there is a real problem related to mathematical competence, especially in biological sciences.
Thank you David for a wonderfully clear explanation of both the theory and its practical application. Not only fascinating but also useful in arguing the case for the NHS!
We have an aquaintance/friend (a retired chemical engineer and the biggest hypochondirac I know) who is constantly banging on about how you should be able to get rid of waiting lists, cancellations etc in the NHS and how if only they would apply a simple business model just like the major chemical company he worked for all those years, all would be well but the NHS is finished, always has to go privately blah blah. So now I can throw some stats and hard maths at him it will be harder for him to dismiss me as a mere female who knows nothing about such things or Mr Lindy as a structural engineer who got out early so doesn’t understand either……
@Seegespenst
You make a very interesting point. At first glance one might think that if we quadruple the number of beds to 16 beds rather than 4, and we also quadruple the arrival rate to 8 rather than 2 per day, then the arrival rate per bed is the same and one might expect everything would stay the same.
As you say, it doesn’t.
If queueing was allowed, the mean queue length would be only slightly shorter, 18,7 rather than 20.9, but the mean time spent in the queue would fall from 10.5 days to 2.3 days.
In the more realistic case, with no queuing allowed, the rejection rate would fall from 29.4% to 15.5% and bed utilisation would increase from 68% to 81%. The rejection rate seems to fall roughly as the square root of the number of beds.
Clearly there is an advantage to having a big hospital with a big HDU.
Stochastic processes quite often behave unintuitive ways (unless you’ve spent years developing the right intuition).
Besides having big HDUs, there are other ways you can exploit this.
There are advantages to having a seamless national health system, where patients can be smoothly transferred to nearby HDUs if convenient. That allows several distinct hospitals to behave like one hospital for these numerical purposes.
According to my medical friends, one of the major problems with running HDUs in the UK at the moment is finding enough suitably-qualified nursing staff. If you are talking 16 beds, staffed round the clock (so probably with three shifts) and with 1 nurse for 2 patients, you are talking an awful lot of highly qualified and experienced nurses.
Similar staffing problems apply on the ITUs, where it is 1 nurse per patient.
The transfer solution James mentions has obvious attractions, but can cause difficulties of its own. One is that transferring people who are sick enough to be in an HDU bed requires a well-equipped ambulance + team, which would include an anaesthetist riding along.
Thanks for the wonderful post David.
Hope all goes well with the operation when it happens.
Probably full of people with adverse drug reactions. Interesting that our friends on the Continent don’t have should chronic bed shortages. O the joys of central planning and medicine by numbers.
@Dangerous Conventional
Oh dear, I do wish you would not feel so free to make stuff up to suit your prejudices (though I suppose that is a defining characteristic of alt med advocates)
You can’t possibly have the slightest idea who was occupying HDU beds on October 23rd, any more than I have.
And will you please send references for your claim that the problem is smaller in Europe? References -you know, real facts. They don’t seem to be much different in the USA but I don’t know about Europe. I lay a small bet that you don’t either. The difference is that I don’t feel free to make things up.
Hospital overcrowding must be reduced if there is to be a realistic chance of defeating the MRSA superbug, a leading infections expert said today.
Professor Barry Cookson, from the Health Protection Agency, said that if bed occupancy was reduced to 85% it would help stop the infection spreading.
But occupancy of beds at British hospitals at present averages more than 100%, a higher level of crowding than almost anywhere else in Europe.
As a result, patients were shunted between wards – and sometimes different hospitals – which increases the chance of acquiring an infection and passing it on.
The lack of single-bed units also made it more difficult to isolate patients with dangerous infections.
MRSA, or methicillin resistant staphylococcus aureus, first appeared in the 1960s but has reached epidemic levels in just the last few years.
Some strains of the bug are resistant to almost all known antibiotics, and fighting it costs the NHS an estimated £1 billion a year.
The MRSA infection rate have soared by 600% in the past decade, and experts fear it will double over the next six years.
Each year about 7,000 patients suffer infections acquired in UK hospitals, of which an estimated 5,000 die.
At any one time they are harboured by 10% of hospital patients.
Attempts to tackle MRSA have largely concentrated on washing hands and other hygiene measures.
But Professor Cookson, director of the Laboratory of Health Care Association Infection at the HPA, said it was important not to ignore the way healthcare was delivered.
He acknowledged that the strong focus on reducing patient waiting times was part of the problem.
Speaking at a briefing in London, he said: “Clearly, this Government, like those in many other countries, is under pressure to treat patients,” he said.
“Patient care is very expensive, and they’ve gone down the path of treating as much as they can to make it as cost effective as possible. Part and parcel of that is looking at bed capacities and through-puts.”
Yet a number of studies have shown that when bed occupancy rises above 85% it opens a window of opportunity for hospital bugs.
This was also recognised by the National Audit Office in its 1999-2000 report on hospital acquired infections.
Professor Cookson said: “What all the evidence shows, and the NAO has found, is that we’ve got to get down to this 85%, but the Government has clearly got its waiting list targets and has signed up to them.
“I think we should be entering a national debate. Patients should realise that there’s a certain safety level, and above that we start having problems.”
Hospital bed occupancy was 85% or less in most European countries, said Professor Cookson. In Spain, it was 65%.
In Sweden, an emerging MRSA problem had accompanied an increase in bed occupancy rates to 100%
MRSA typically infects surgical wounds, and has been encouraged by the increasing complexity and invasiveness of hospital treatment.
Modern techniques had the advantage of keeping patients in hospital for shorter amounts of time, giving them less chance to pick up infections, said Professor Cookson.
The other side of the coin was that it was becoming more difficult to detect and monitor MRSA outbreaks.
Patients leave hospital so quickly that they develop their infections after being discharged. When they return for check-ups, there is a risk of the bug returning with them.
Dr Alison Holmes, from the Department of Infectious Diseases at Imperial College, London, and Hammersmith Hospital, said that, ideally, certain high risk patients should be “ring fenced” and kept away from other groups. They included those having orthopaedic or heart surgery.
But she added: “It’s very difficult to ring fence any of these groups when you can’t keep any beds empty.”
She agreed that overcrowding was contributing to the problem of hospital infection.
“We have to recognise that admission pressures are interfering with infection control practice,” she said.
“We’re trying to stick as many patients in hospital as possible. This involves a lot of juggling and leads to an increased risk of infection.”
She said it was vital for everyone involved in health care, and not just infection control specialists, to play a part in fighting the superbugs.
The Government’s NHS Improvement Plan, which sets targets for the next five years, has pledged “significant reductions” in MRSA infection rates between now and 2010.
@Dangerous conventional
I’m delighted that you too would like to see more money spent on the NHS.
But hang on, I thought you were the one who is against conventional medicine.
The NHS is a very inefficient way of delivering healthcare. As P J O Rourke said, ” If you think healthcare is expensive wait to you see how much it costs when it’s free”. Despite vast sums being hosed at the NHS over the past twelve years areas such as mental health and care for the elderly have seen a deterioration in service standards. The NHS died when fund holding was scrapped and replaced with top heavy PCTs.
I was a prescribing advisor for three PCTs so do know a little bit about the NHS. I’d be interested to know what your experience of the NHS is and how you would fund it with a £210 billion short fall in government revenues?
Well P.J.O’Rourke was quite wrong. The US spend far more per head, despite miss out a large fraction of the population.
I agree about their being too many highly-paid managers of course. It is just the same in universities. I expect you’d enjoy claasic ‘redisoganisation’ paper, despite the fact that its authors include two of the great luminaries of evidence-based medicine, David Sackett and Iain Chalmers
Despite this, my own experience of the NHS has been superb. I have described some of it in why I love the NHS. Has your experience as a patient been worse than mine?
I’ll confess that I find it a bit scary the you used to be a prescribing advisor for three PCTs. You weren’t by any chance the person who was responsible tne approval of magnetic bracelets on the NHS, a matter that gave me some fun in 2006.
http://www.liberty-page.com/issues/healthcare/superbug.html
Old news, apparently.
@Prof C
One of the most interesting blogs I’ve read. I hadn’t really ever thought about bed filling in mathematical terms.
In your model I think it assumes there is a rigidly defined point at which patients can be transferred out of HDU.
I used to work on an ITU which had some HDU level beds and I think my experience was fairly typical. We would start every shift knowing how many beds were free, if any, and by making plans for possible discharges, if the need arose. And others that we could discharge, if the need really arose. This allowed us to achieve bed occupancies well into the steep part of the rejection part of the curve.
Similarly if the unit was quiet I am sure we would admit a few who we were worried would ‘go off’ to keep an eye on, but didn’t really need to be there.
Don’t be surprised if the occupancy rate is in the dangerous part of the curve when you’re there. Or if you get bumped off the unit should someone else need to be admitted. Routinely admitting to HDU post-nephrectomy is not done in all hospitals, I’m not sure how necessary it is.
Of course every now and again we’d have to transfer patients to another unit because we were full and needed to admit someone. The units can’t really be described as discrete entities, although every transfer was an additional risk and inefficient use of manpower.
Good luck with the op
@Puzzlebobble
Thanks. It was certainly fun for me to forget the magical school of medicine for a while and write about something I enjoy.
The assumption that was made in the calculations was that the length of stay in a bed was random (in the sense that the durations are exponentially distributed). That is never likely to be true exactly, but it can be checked empirically and in the McManus study it seemed to be a pretty good approximation,
The mathematics exists for doing the calculations with other sorts of distrubution than exponential, so ut should be possible to do realistic calculations in other cases too. It isn’t the sort of calculation that needs to give a very accurate result. The qualitiative behaviour, e.g what to expect if you quadruple the number of beds, is where calculations like these may be helpful.
Puzzlebobble
Mrs Dr Aust says they don’t operate that sort of “shift to make room” system much now, as audits showed a slight increase in mortality in those “shifted” out of ITU/HDU to ward beds even when they were pre-identified as “possibles to move”. Although this was probably due to things that could be fixed, e.g. by not doing the “shift” at times of day when handover would be rushed (like at 5 pm) or at times when the patient moved to the ward would be going when there would be lower staffing levels and less monitoring (e.g. at night). She says the current view is “only move the patient out of ITU/HDU when it is agreed it is really the right time to move them”.
She says a lots of places tend to have the ITU/HDU physically together, as you describe, since then “regrading” a patient from ITU status (1 to 1 nursing) to HDU (2 to 1) can be done without physically having to shift the patient, which means no need for transfer of responsibility, less running around for doctors in particular and thus better continuity.
What all this tells us is that there is continuous “surveillance” of outcomes in ITUs and HDUs via audit etc. so that the processes can be optimized as far as possible, obviously a good thing.
Of course, it is about 5 years since Mrs Dr Aust was an ITU/HDU doc, so things may have changed again since then.
“Dangerous Conventional: Probably full of people with adverse drug reactions. Interesting that our friends on the Continent don’t have should chronic bed shortages. O the joys of central planning and medicine by numbers.”
I am sorry, but in 2 countries on the European continent, where I have works as a hospital medical doctor. There was and is chronic shortness of beds. The last month I was on call in the Emergency department, we had to close the hospital for further admissions, 1.-2 days a week. On top of that, the politicians/administrators say that the patients want to be treated in out-patient-clinics, and therefore they want to reduce the number of beds even further, so they can save money.
David: Thanks for a good post!
The song “Storm” by Tim Minchin, that deal with Alternative medicine,
made my day 🙂
Comment no 21 by Dangerous Conventional is obviously a quote from a media article as it reads just like a press release. Sure enough Eric the half (what a great name!) exposed the source, and it is about five years old.
Two things occur to me. Firstly it is usual in scientific circles and elsewhere to acknowledge the source of material if it is not original rather than make it appear to be contemporary and also your own. Secondly I feel that someone who is capable of such lack of rigour could be seen as highly unsuitable for giving advice on prescribing.
@dr aust
Sounds like Mrs Dr Aust and I were working in ITUs at roughly the same time, I only do occasional locums now. I don’t doubt that discharging early is risky, particularly at night.
I think the difference between our experiences is probably explained by variation in hospitals. If you’re in london I’d put money on her having worked at St Thomas’.
Lindy; I gave up quoting from peer reviewed journals after my comments about diclofenac where dismissed with references to some GP blog. Returning the compliment.
Good week for aspirin.
No ones managed to answer my point about funding the NHS with a £210 billion pound government deficit. I’m all ears. Or we could wait until May for Strauss Khan from the IMF to sort it out for us. The Irish could be cutting healthcare expenditure by 20% in December to avoid having to go to the IMF.As for healthcare in the Baltics (where the IMF have already been in), don’t ask. Times are a changing.
re: comment 33
Surely you can see that I was not commenting on the source of your material, rather I simply saying that it would have been polite to the authors and helpful to your audience had you clarified who had been the author of the piece and where it had been published. I apoligise if I did not make this clear enough.
Dangerous Conventional, you are a pompous p***.
And yes, that is meant to be rude and dismissive.
Yes, again, for at least two reasons:
First, because the GP bloggers, who actually hand out the drugs, obviously had a sophisticated overall view of risk vs benefit that you rather evidently lack, despite your less than convincing claims to expert knowledge. They also try to communicate their knowledge in terms people can understand.
[And actually I cited the GP blog before you started the Ctrl C-Ctrl V routine]
Second and linked, because all you did was quote references to studies highlighting risks. For instance, the Pirmohamed paper, which you quoted at length, specifically about admissions to hospital resulting from drug side effects. No-one denies risks exists, and hence this well-known paper would already have been read by anyone interested in NSAIDS, drug adverse effects, etc etc. Cited and quoted the way you did it, with NO reference to the actual benefit-to-risk “weighing up” which goes on for these drugs and has been debated extensively in the literature, was pure scare tactics.
Which is, of course, a regular device of Alt.Reality scare-mongers trying to frighten the punters – namely quote, without all the relevant context, something that all the real experts who make the decisions have already factored into their thinking. The “fake reveal” can then be used to make a bug fuss about “THIS is what doctors, the paid minions of Evil Pharma, aren’t telling you – be very afraid”. All with the aim of frightening the uninformed, rather than informing them.
It is an easy schtick to do, and thus beloved of numerous Alt.Medicine people. It’s SO easy to do that I’ve even done it myself when I had to pretend to be an Alt.Med person and “propose” CAM use for a mock debate. But that doesn’t make it true. It is like a politician telling a story about their schizophrenic constituent whose family are convinced that smoking skunk put their son over the edge, and using that to ridicule the kind of figures that show that the statistical risk from cannabis smoking is less than that from alcohol use.
Thank goodness most systematic review of things like “overall risk vs benefit for using NSAIDS for condition X” are written by those with an ability to actually weigh evidence, and not by the one-eyed.
The thing that really scares me is your claim that you were a prescribing adviser for three PCTs.
Even the bible of evidence based medicine questions the value of many conventional therapies;
http://clinicalevidence.bmj.com/ceweb/about/knowledge.jsp
So what can Clinical Evidence tell us about the state of our current knowledge? What proportion of commonly used treatments are supported by good evidence, what proportion should not be used or used only with caution, and how big are the gaps in our knowledge? Of around 2500 treatments covered 13% are rated as beneficial, 23% likely to be beneficial, 8% as trade off between benefits and harms, 6% unlikely to be beneficial, 4% likely to be ineffective or harmful, and 46%, the largest proportion, as unknown effectiveness.
So you lot are happy to slag off alternative medicines for lack of evidence. So 36% of treatments are of benefit or “likely” to be beneficial. So what about the other 64% that the NHS is handing out like sweeties.Of course these medicines of limited evidence base have no side effects.
Finally, I think I’d like to point out you missed off a *. Thank you.
No, ‘prig’ only has four letters. And since you pick on such things what do you mean (#33) “No ones managed….” etc.?
You still don’t get it do you? Whilst you refer to a link to BMJ Clinical Evidence, you still do not make it clear that you then quote from that link. This is utterly sloppy, but does not surprise me, given the selectiveness in what you throw out and in your arrogance and your pomposity.
I was thinking more “prat” than “prig”, Lindy, but “prig” works too.
“Dangerous Conventional” wrote:
This is another tired old canard, trotted out ad nauseam on Alt.Reality websites. For a discussion of precisely this point from a noted academic neurologist – i.e. not an internet Alt.Reality troll – see here (and also the paper it cites which is here).
What the 36% figure from BMJ Clinical Evidence refers to is things where a large number of randomized clinical trials have been done and where either almost all show positive results (“beneficial”), or most show benefit (“likely to be beneficial”).
Lots of things are, of course, not covered by RCT evidence because RCTs for them are difficult or impossible to do (e.g.replacing your knee) or because it is so obvious that not to do them would be harmful that (i) it is blindingly obvious and (ii) no sane ethics committee would sanction a trial. For instance, if you are in resus with no blood pressure and a big pool of blood on the floor it does not take an RCT to tell the doctor that what is needed is blood and/or fluids. Equally, it does not take a trial to tell you that it will be a bad thing if the doctor sticks a chest drain in without giving the patient local anaesthetic first.
The more sensible and less misleading answer, it turns out, is that closer to three-quarters (75%) of all conventional treatments are supported by some kind of compelling evidence. And even for the other 25%, the doctors are doing their best to work on the evidence they have – typically weaker open trial / anecdotal / “weight of expert opinion” stuff.
Note, BTW, that this last kind of weaker evidence is the sort of thing that – when produced for a small fraction of the CAM therapies – causes the Alternativists to insist loudly that we should enthusiastically embrace all the CAM modalities en bloc.
The double standard is instructive.
There is also the point Badly Shaved Monkey made on the other thread, namely that at least conventional medicine makes a point of compiling these kinds of figures and grading the evidence in various ways (in fact a major point of BMJ Clinical Evidence is to identify where RCTs are scarce precisely in order to encourage people to do them). The only person who has systematically done anything similar for CAM is Edzard Ernst – a heroic and important task which has, not uncoincidentally, earned him the undying enmity of practically every Alt.Reality practitioner in the UK.
Dangerous Conventional, your use of this well known Alt.Reality bait ‘n’ switch (again, citing the numbers without the explanation) demonstrates, for the umpteenth time, that you really do not know what you are talking about. Or possibly you do, but you are mainly interested in misleading people.
Whether you are “a fool or a knave” I will leave to other readers to decide.
I quote from the link for the hard of thinking.
Let’s look at this from the patients point of view. Imagine Gladys finds out that she’s got type 2 diabetes. The doctor quite rightly considers storming metformin.Why is this a good move because metformin, unlike many conventional medicines has primary end point data. This is what Gladys wants because it will reduce her chances of developing macrovascular complications (see UKPDS).She’s worked out that the NNT for metformin is 16. Excellent.
The problem now for Gladys is that her doctor, thanks NHS targets and the doc’s got a Tuscan villa to maintain, wants to put her on a gliptin to hit her HbA1C target. Gladys asks if this drug has primary end point data and what the NNT is.The doctor looks uneasy. Remember rosiglitazone yells Gladys and how that didn’t have primary end point data. Look how many developed cardiovascular complications she yells.Sorry says the doctor to Gladys but most RCTs look at surrogate markers and not primary end points so are pretty much useless.Oh dear.
Even those drugs that do have primary end point data are pretty useless. The Heart Protection Study found simvastatin 40mg to have a NNT of 22 (irrespective of cholesterol levels, so why do we measure them) while a Mediterranean diet has a NNT of 8.I’ll stick with the sardines, they’re safer and taste better.
Why was rosuvastatin allowed on the market without any primary end point data? Why are any drugs allowed on the market without primary end point data. Because there would be many found to be of any use.
UKPDS 38/39 United Kingdom Prospective Diabetes Study Group BMJ 1998: 317: 703-713
Heart Protection Study Lancet 2002; 360:7-22
Crikey, Dangerous Conventional, you’ve finally said something I agree with:
Sardines are jolly good for you. And tasty.
And if I ever meet a GP with a Tuscan villa I’ll be sure and let you know. I suspect said GPs are only marginally more common than Unicorns.
I really enjoyed this Markov queuing analysis for NHS beds. Being able to do the maths is good for those of us who can, but I agree with another poster that putting this into a computer model will help more people to appreciate the trade-offs in real-world situations. I too love the NHS though fortunately I have been a ‘customer’ very few times (maybe because I eat sardines).
[…] have been reading David Colquhoun’s blog for some time, and this entry is brilliant: Queueing for beds, Andrei Andreevich Markov, and why I still love the NHS. This shows the real scientist – a personal experience is turned into a small investigation. […]
The issue of using the capacity in the beds is important to manage for a number of reasons. One of these is the number of staff needed on the wards. While the severity of the cases makes a difference, having a good prediction of how many patients there will be is complementary information.
Strangely, predictions can be improved for overall needs, perhaps not high dependency, by using the weather forecast (doi: 10.1111/rssa.12008). This is because variability in general admission is dominated by old people with acute phases of chronic conditions. And these occur more when it is cold. Simply incorporating forecast temperature into your staffing planning can improve your staff allocations. But I don’t expect that many hospital do something so sophisticated.
That’s an interesting idea, but I imagine there’d be real problems if you wanted to change staffing levels at 2 or 3 days notice. Where would you find a pool of people available to work under conditions like that?